Ask Reuben
FGLSVGCANVAS
How can I create my own widget?
My 3rd party charting tool does not allow me to do what I want?
How can I render information graphically?
What has happened to CANVAS widget?
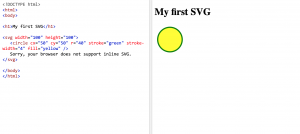
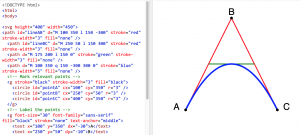
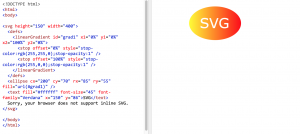
Todays Ask-Reuben is about fglsvgcanvas, it is going to be a little bit different as I am not going to include any code. What I will do is point you at the various resources we have where you can learn more about fglsvgcanvas, and you can pick and choose from there and learn from what resource suits you best. But first, what is fglsvgcanvas? Fglsvgcanvas is a built-in web component that gives you a rectangular area of the screen where you can render and interact with Scalable Vector Graphics (SVG). It is a rectangular area of the screen where you effectively render any pixel in whatever colour you want rather than being constrained to using the widgets, containers, styles etc that are available in our user interface. I say pixel but in reality you choose to draw objects such as lines, circles, rectangles rather than colouring every point individually. If you have not come across a built-in web component before, it is where we supply the .html, .js web component files and a 4gl interface to save you reinventing the wheel. Other examples include fglgallery and fglrichtext. As it is included in the download package and is included in the documentation, you can consider it supported as if it was 4gl syntax. You used to be able to use the CANVAS widget to draw shapes in your Genero form but that has now been deprecated in favour of using fglsvgcanvas and having access to the wider range of functionality SVG provides in its community i.e it is worldwide. What you can produce using SVG is very wide. From a Business Applications point of view, this will typically include graphs, charts, and infographics. Interaction is supported so you can click on this graphical information and code the ability to respond to the chosen click e.g. drilldown. You can use this interaction to select choices from visual information e.g. draw a map of your warehouse and allow the user to click on the selected area of the warehouse to select a location within the warehouse. You could use a 3rd party web-component for these graphical requirements and follow the adage of buy before you build, however you may find yourself constrained by what the 3rd party provides and makes available. Using fglsvgcanvas you are more in control of your destiny. SVG is a standard maintained by the World Wide Web (W3C) consortium. You can reference their standards documentation here. To learn more about SVG, w3schools has a section on SVG. The w3schools documentation has many examples and a reference section. You can do the normal w3schools thing of trying and experimenting with the examples for yourself so you can see what is possible. This is where I will come to learn the expected syntax and to experiment using the try-it-yourself examples, and build up the expected SVG that I then have to get my Genero program to create.Introduction
W3C
W3Schools
Documentation
To learn about our fglsvgcanvas library, first place to make you aware of is our documentation. The documentation includes references to the methods and some pre-defined constants.
For the most part the methods are self-explanatory. They typically reference an SVG object. For example the method rect(x,y,width,height,rx,ry) references the SVG rectangle shape.
The one method you will need to use (but not necessarily fully understand) is the initial method setRootSVGAttributes. This defines the svg root node and introduces concept of viewport.
The documentation includes two examples you can copy and run but you will also find those examples in FGLDIR/demo/webcomponents
FGLDIR/demo
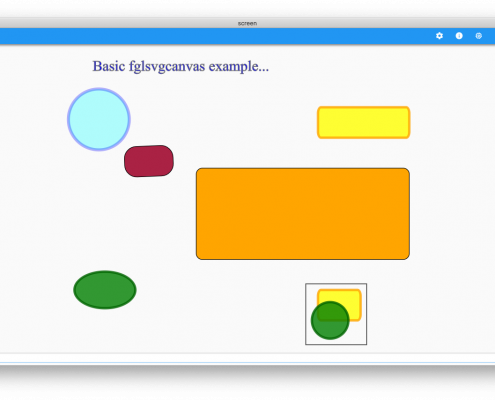
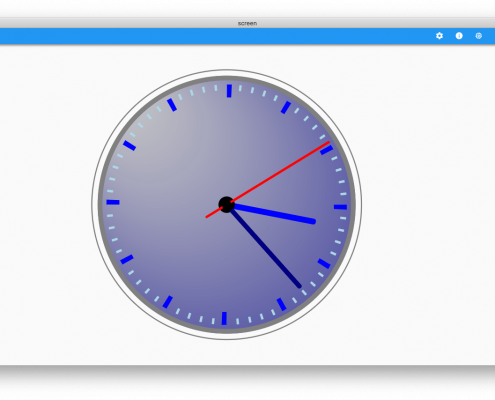
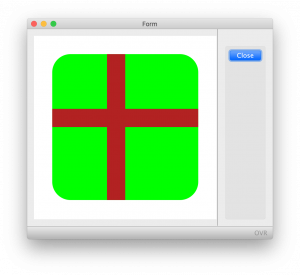
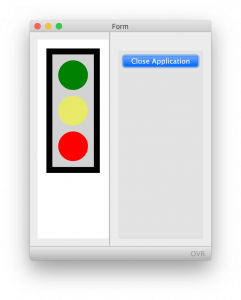
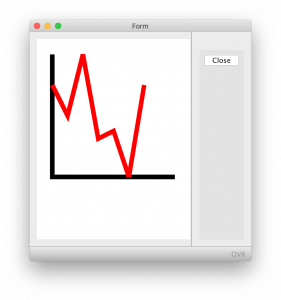
In FGLDIR/demo/webcomponents there are two examples that you can compile and run, svgbasics and svgclock
Sources
fglsvgcanvas is a supplied web-component, so you will find the …
- web component it uses in FGLDIR/webcomponents/fglsvgcanvas
- the source for the library in FGLDIR/src/webcomponents/fglsvgcanvas
- and the compiled library is FGLDIR/lib/fglsvgcanvas.42m
… you should not need to touch these but you can view these to increase your understanding.
E-Learning
The Self-Paced Training Portal has a class titled “The fglsvgcanvas web component: Create and Display Scalable Vector Graphics (SVG)“.
If you have not used the Self-Paced Training Portal before, send an email to elearning@4js.com and ask for a login.
WWDC
At WWDC20, Scott Barney introduced the self paced training portal and on the last day he worked through the above class on fglsvgcanvas. You can find his presentations and recordings on this page.
At WWDC18, John Hobach did a presentation “Unlocking the potential of fglsvgcanvas”.
GitHub
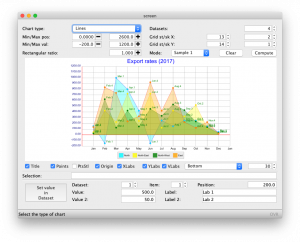
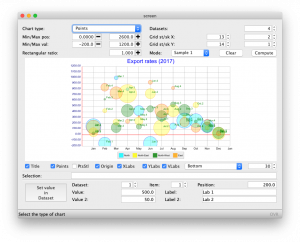
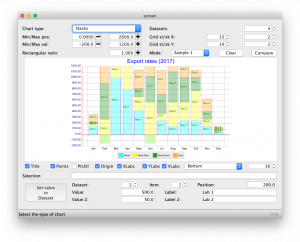
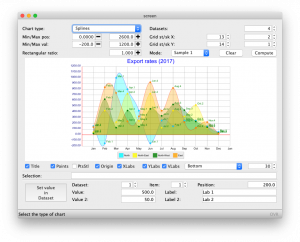
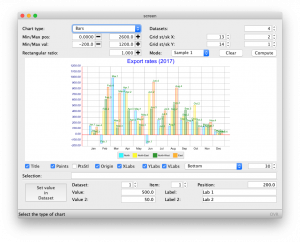
The repository fgl_svg_chart can be used as a starting point to render various charts using fglsvgcanvas. It demonstrates how you can build up your own charting library (named fglsvgchart) that sits on top of fglsvgcanvas. The demo program allows you to render some charts from a set of data and to change the inputs to the charts including things like type (bar, lines etc), axis properties (minimum, maximum, steps) etc.
To aid the gap between junior and senior developers, it is likely you will create own equivalent library so that your junior programmers don’t have to deal too much with fglsvgcanvas and can simply specify data and properties of charts to be drawn, just the same as if you were using a 3rd party Web Component.
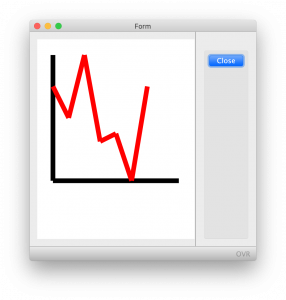
The screenshots below are some of the charts produced in the demo program.
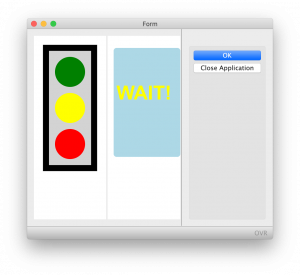
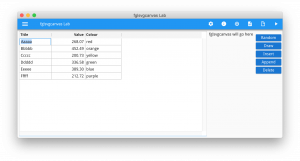
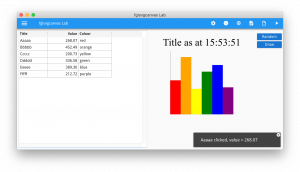
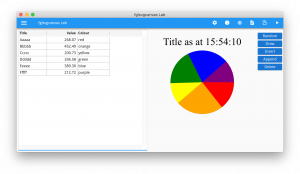
Another web component repository ex_fglsvgcanvas_lab is one I wrote when we were first discussing having a self paced lesson on fglsvgcanvas. It is in my personal area It demonstrates how I built up my knowledge of fglsvgcanvas. It shows how I start …
- with data and a blank web component, and then …
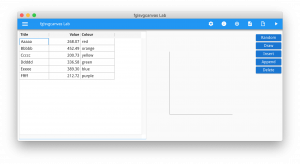
- add ability to draw lines (axes for a chart)
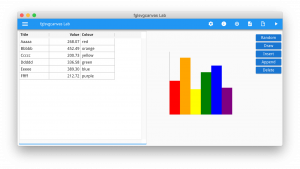
- add ability to draw rectangles (in a bar chart)
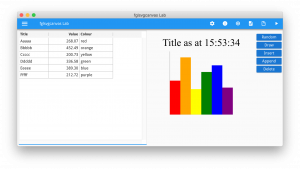
- add ability to draw text (title of a bar chart)
- add ability to interact with chart (what bar has user clicked on?)
- add ability to do more complex drawing (turn bar chart into pie chart)
… similar to the approach taken in the self paced class. I have left this available so if you want more practise or examples, you can look at them.
It fits in with my learning philosophy of starting from known positions and taking small steps out to form a new known position, and always having that known position to fall back to if you make mistakes.
Coding Note
I said at the beginning I wasn’t going to code an example. There is a coding choice I think you should note.
The fglsvgcanvas library has a number of pre-defined constants that you can see in the reference documentation. You should make a conscious decision wether you use these constants or the css equivalent. For example, do you code …
addAttribute(SVGATT_STROKE, "blue" )
or
addAttribute("stroke", "blue")
Using the constants will give you code-completion and correctness, you can type SVGATT_ and get a list of available attributes, but if you know CSS you may be more comfortable typing the CSS selector “stroke” just as if you were editing css/html.
You should note that the list of methods are the building blocks. For instance to code the slice of a pie chart is something like …
LET path = SFMT("M %1 %2 A %3 %4 0 %7 1 %5 %6 L %8 %9",
                 p1.x, p1.y, RADIUS, RADIUS, p2.x, p2.y, IIF(arc <= util.math.pi(), 0, 1), SIZE / 2, SIZE / 2)
LET n = fglsvgcanvas.path(path)
... from current point, move to a point, draw an arc, and draw line back to the start position. This article explains this. So don't consider what you see in the fglsvgcanvas as exhaustive. There maybe some SVG syntax that is not included in fglsvgcanvas, and it maybe that doing something involves a combination of what is available in the fglsvgcanvas library.
The methods and constants exist to try and hide some of the SVG / CSS syntax complexity.
Summary
There are a number of different ways to learn about fglsvgcanvas. I would suggest quickly studying them all and decide what works best for you.
The above will give you the basic building blocks. When you know how to draw a line, and some text, and react to a click, you can create a lot.
I would expect most Genero developers to include Web Components in their application, and if they aren't using 3rd party web components, then look to build up your own libraries using fglsvgcanvas to add interactive graphical objects to your application.


