Ask Reuben
Excel via Table (.4rp)
How to create Excel spreadsheet via Genero Report Writer
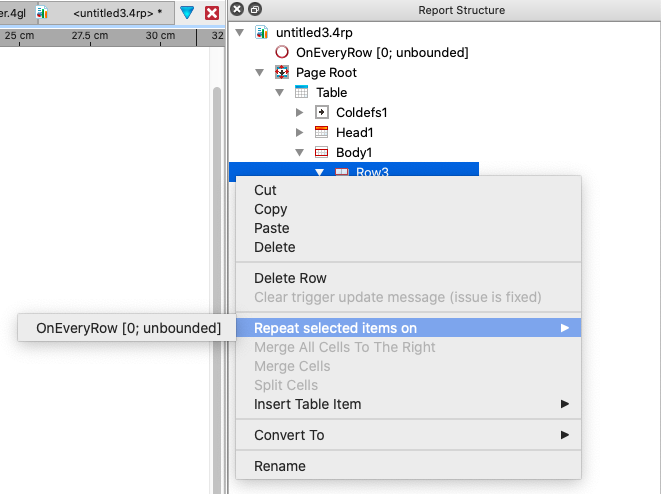
This article carries on from an earlier article (https://4js.com/ask-reuben/ig-172/) which in turn referenced an earlier article (https://4js.com/ask-reuben/ig-62/) on the topic of creating Excel spreadsheets using Genero. In this article I show how you can create a report design (.4rp) featuring a single Table object to arrange the data from your Genero program into an Excel spreadsheet. I have placed the code example at the end of the article. This features fgl_report_* calls to use Genero Report Writer. They are similar to the calls used in the earlier article. Only this time making sure that … … the fgl_report_loadCurrentSettings call references a report design file. We will design that report layout later in the article. Otherwise the 3 other fgl_report* calls are the same … … making sure that XLSX and not XLS is used with fgl_report_selectDevice. Using XLS will limit the number of rows to 65,536. … using fgl_report_configureXLSXDevice and setting the last mergeCells to TRUE so that one sheet is produced, not one sheet per every 50-60 lines. … and fgl_report_setXLSXMergeCalls to FALSE to avoid blank cells being merged with adjacent cells. With the REPORT statement in your .4gl, this works best if there is a single PRINT statement in the REPORT / FORMAT / ON EVERY ROW. The key is for the 4gl to gather the data and send the rows of data to the report engine. The 4gl does not need to do any formatting of data, it just needs to generate it and send it to the reporting engine. Having created your 4gl program and then the report data schema (.rdd) you next need to create a report design file (.4rp). The basis of this technique is that your .4rp uses a single Table container. So to start with, the first fours steps in Genero Studio you will initially take are That last step will look similar to this …
IF NOT fgl_report_loadCurrentSettings("filename.4rp") THENCALL fgl_report_selectDevice("XLSX")CALL fgl_report_configureXLSXDevice(NULL, NULL, NULL, NULL, NULL, NULL, TRUE)CALL fgl_report_setXLSXMergeCells(FALSE)
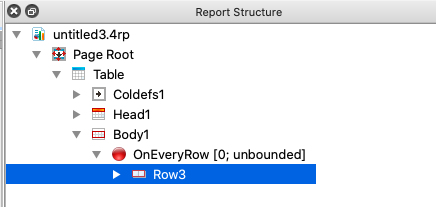
That should then give you a Report Structure that looks like this, the key being that a table row is repeated for each On Every Row
… note that the Body->Row is a child of the On Every Row trigger. Every time the ON EVERY ROW is triggered in the 4gl, this will correspond to a row of data in your spreadsheet.
To add data items to your report, from the Data View, make sure that in the Data View header, the “Create an element based on the report context” is selected (number 6 in the diagram on this page). Then for the elements in your Data View that you want to appear in the spreadsheet, drag them twice into the report. Once into Table->Header->Row?>Col?, and then again into Table->Body->Row?->Col? (where ? is the number allocated by the report designer). This should put a WordBox to display the title in the appropriate column in the header, and put the appropriate Report Object (WordBox, Decimal Format Box, Date Format Box etc) in the appropriate column in the header as per Table 2 on this page)
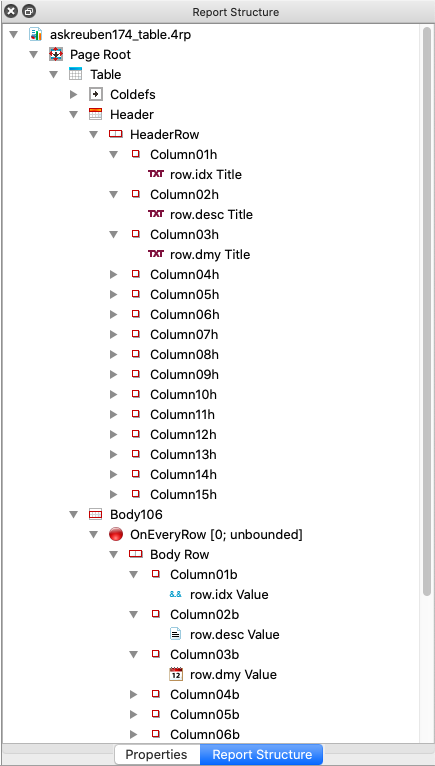
The Report Structure will now look something like this … (I have expanded the first 3 columns and collapsed the remaining columns so you can see both header and body)
(Note: That is two drag events per column, one for the title, one for the value)
I then make the following changes to some properties of the Table object.
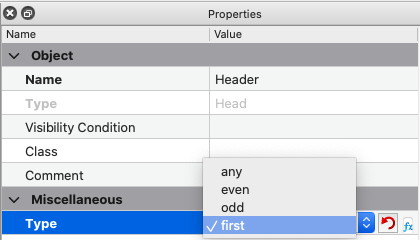
Select the Header and change the Miscellaneous->Type property value from “any” to “first”. This means that the column headers will only be displayed once.
In the Table node I delete the Table->Rule and Table->Border values. With the default value of fgl_report_setXLSXHandleBorders this step is probably unnecessary, but it is probably a good idea to be aware of this function and what it does and decide wether to leave the default values as they are or be explicit and unset them.
For the width of the various columns, I like to use the Table->Proportional Width values. Typically our data will be numeric and all the same width, but if there is a description column I might increase this value from 1 to 3 or 4 so that that particular column is rendered wider.
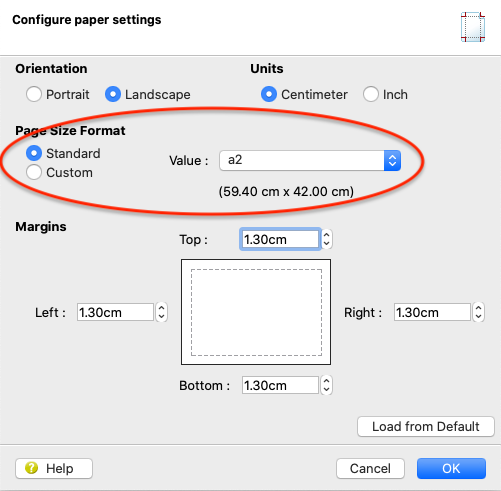
I then go into File->Report Properties and then change the Paper value to a bigger paper i.e a3, a2 etc, or select a custom page size. The idea is to tell the report layoutter it has all this space to display the columns rather than the report layoutter trying to squeeze a spreadsheet onto a piece of a4.
The net effect of doing is is that you should get a spreadsheet that has a 1-1 correspondence between cells in the spreadsheet and cells in the Table object.
You may need to experiment with the paper size setting and the column widths to get a suitable output. if you do not get a suitable output it is most likely that one or more report elements are not being rendered in a suitable amount of space, hence make the column wider or the page wider.
The benefit of this method over the FLAT LIST compatibility mode method in the earlier article is that you have control over the format of the data output using the Report object properties. For example, you might choose to make the headings bold, change the text in the column headings, change the number of decimal places output, calculate a value etc.
The technique in this article is good for creating the raw data sheet which can then be passed to your Business Analysts to do more analysis.
The benefit of the Apache POI method in the first article is that you have even more control over each cell. You can create multiple sheets and more complete spreadsheets, for instance putting formula in cells, creating pivotTables etc.
If you are looking to create a finished spreadsheet, the ApachePOI is in my opinion the better technique. If you are looking to create that first sheet of a spreadsheet with raw data that someone will then take and expand on, the techniques in these two recent articles is the better path for you to explore.
#! askreuben174_table.4gl

IMPORT util

TYPE rowType RECORD
    idx INTEGER,
    desc CHAR(80),
    dmy DATE,
    qty01 DECIMAL(11,2),
    qty02 DECIMAL(11,2),
    qty03 DECIMAL(11,2),
    qty04 DECIMAL(11,2),
    qty05 DECIMAL(11,2),
    qty06 DECIMAL(11,2),
    qty07 DECIMAL(11,2),
    qty08 DECIMAL(11,2),
    qty09 DECIMAL(11,2),
    qty10 DECIMAL(11,2),
    qty11 DECIMAL(11,2),
    qty12 DECIMAL(11,2)
END RECORD
CONSTANT ROWS = 500

MAIN

DEFINE arr DYNAMIC ARRAY OF rowType
DEFINE i INTEGER
DEFINE grw om.SaxDocumentHandler

    FOR i = 1 TO ROWS
        LET arr[i].idx = i
        LET arr[i].desc = "Lorem Ipsum"
        LET arr[i].dmy = TODAY
        LET arr[i].qty01 = util.Math.rand(1000000)/100
        LET arr[i].qty02 = util.Math.rand(1000000)/100
        LET arr[i].qty03 = util.Math.rand(1000000)/100
        LET arr[i].qty04 = util.Math.rand(1000000)/100
        LET arr[i].qty05 = util.Math.rand(1000000)/100
        LET arr[i].qty06 = util.Math.rand(1000000)/100
        LET arr[i].qty07 = util.Math.rand(1000000)/100
        LET arr[i].qty08 = util.Math.rand(1000000)/100
        LET arr[i].qty09 = util.Math.rand(1000000)/100
        LET arr[i].qty10 = util.Math.rand(1000000)/100
        LET arr[i].qty11 = util.Math.rand(1000000)/100
        LET arr[i].qty12 = util.Math.rand(1000000)/100
    END FOR

    IF NOT fgl_report_loadCurrentSettings("askreuben174_table.4rp") THEN
        EXIT PROGRAM 1
    END IF
    CALL fgl_report_selectPreview(TRUE)
    CALL fgl_report_selectDevice("XLSX")

    CALL fgl_report_configureXLSXDevice(NULL, NULL, NULL, NULL, NULL, NULL, TRUE)
    CALL fgl_report_setXLSXMergeCells(FALSE)

    LET grw = fgl_report_commitCurrentSettings()

    START REPORT table TO XML HANDLER grw
    FOR i = 1 TO ROWS
        OUTPUT TO REPORT table(arr[i].*)
    END FOR
    FINISH REPORT table

END MAIN

REPORT table(row rowType)

FORMAT
ON EVERY ROW
    PRINTX row.*
END REPORT

