Ask Reuben
Report Positioning
How do I position a report element in the center?
How do I position a report element on the right-hand or bottom-edge?
How do I position a report element adjacent to another report object?
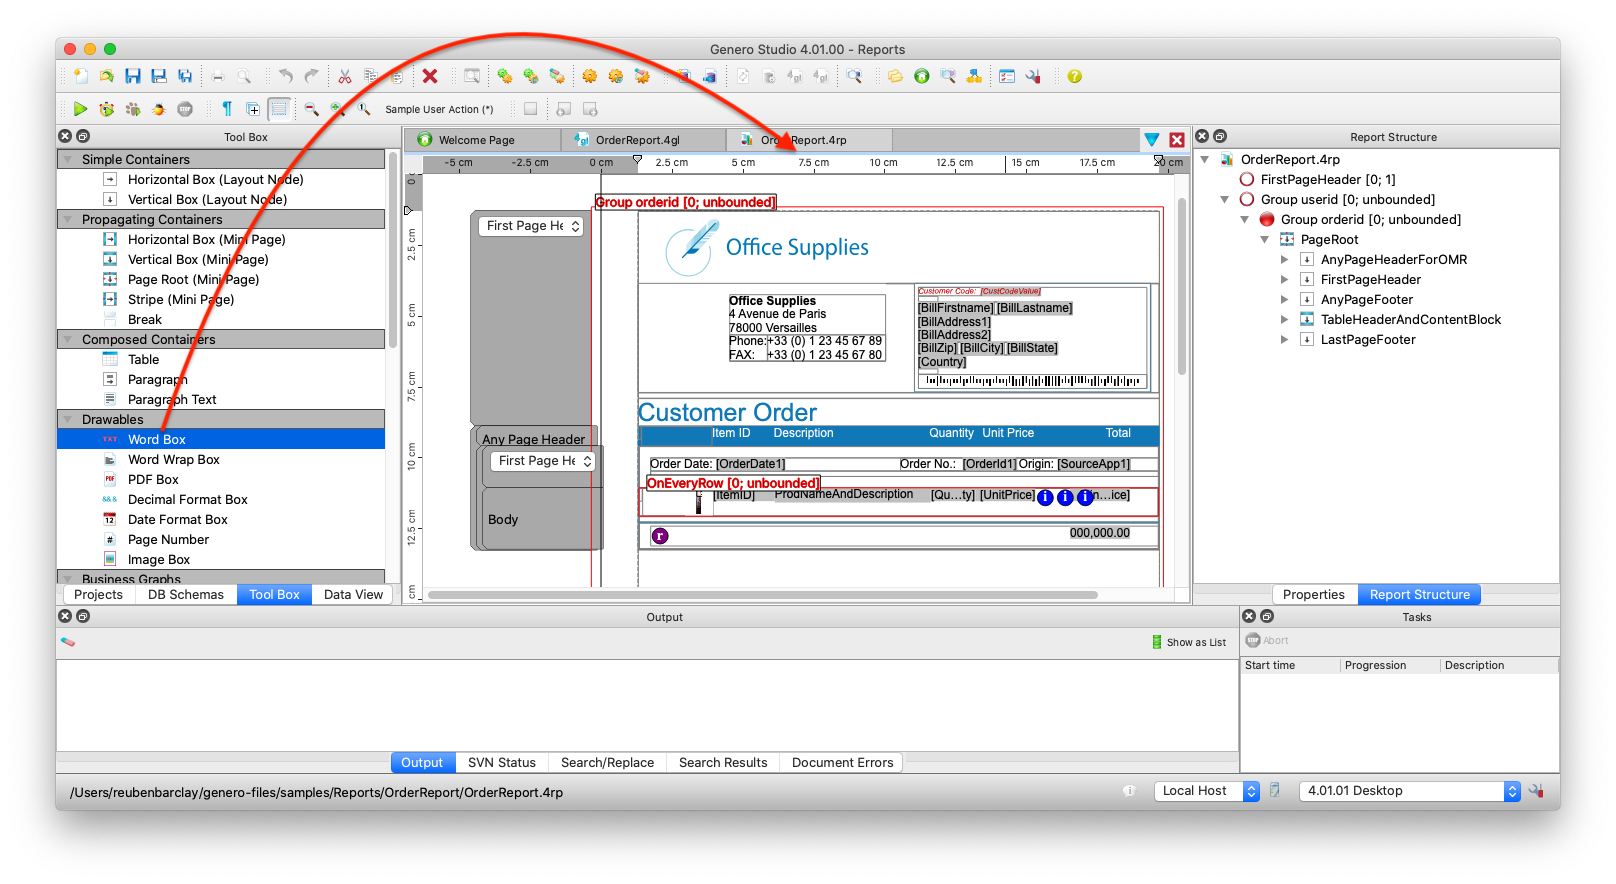
When it comes to placing report elements on a report, the easiest thing to do is to drag an element from the Tool Box or the Data View and drop it onto the Design View, and then use the mouse to drag and refine the position of the element until it is just so.
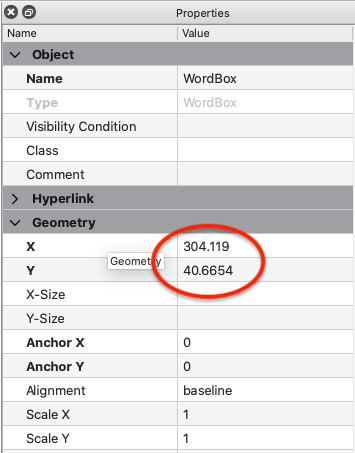
When I see these X,Y values with numbers of decimal places, that is normally a indicator of what I would consider a poorly designed report. This is a report that will not adapt to different font-sizes, different data values and will be costly to maintain. A request in the future to move or change one report element will typically end up with multiple report elements having to be re-positioned.
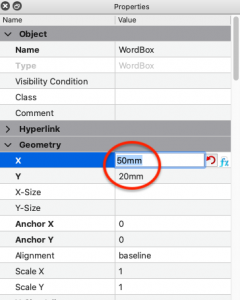
About the only time I would expect to see precise values in the X,Y properties is if there is some physical reasoning for the position of the report element. Examples of that might include positioning the name and address so that they are visible in the window of the envelope that the document is to be placed in. If they are to appear in a precise position based on physical location then it is a good practise to express the X, Y, X-Size, Y-Size in a physical units of measure such as milli-metres (mm), or inches (in). This example below is 50mm from the left and 20mm from the top
A report design has the concept of absolute and relative positioning. It also has the concept of inheritance / parent-child. At the top of you have a Page Root node and then report elements arranged in a tree that can be viewed in the Report Structure view.
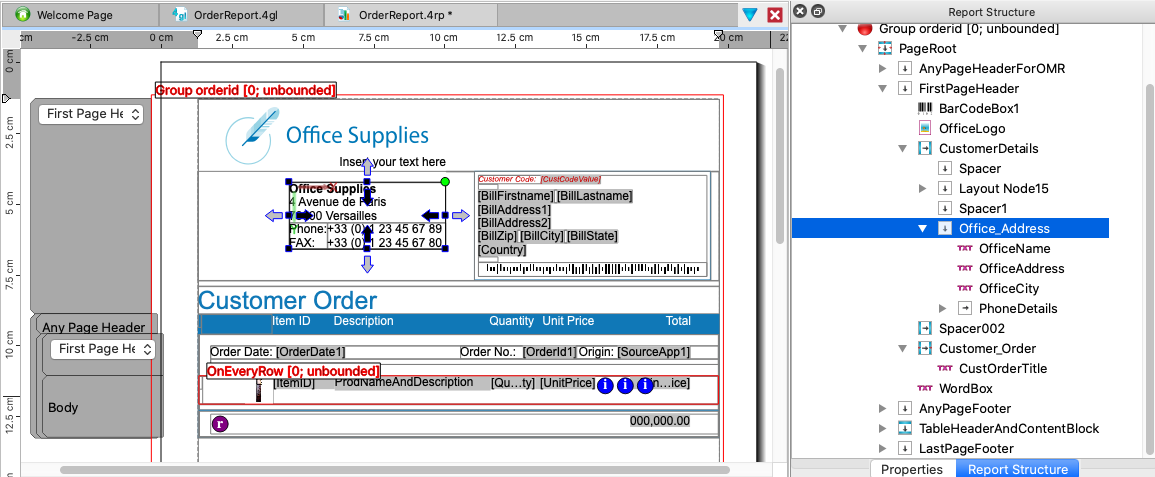
A good report design arranges report elements beneath some containers so that report elements inherit properties from the parent element. The parent can then be moved and its child elements will move with it. I gave the example of name and address elements being positioned so that they appear in the window of an envelope. A good design will have a Layout Node that is positioned to appear in the right place for the window of the envelope.
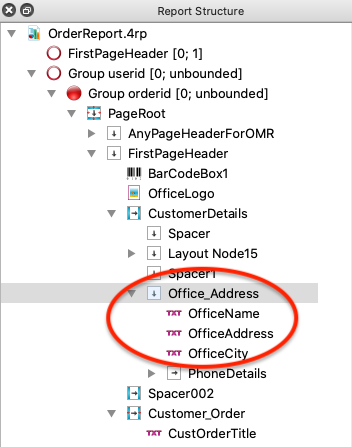
In OrderReport.4rp from Tutorials&Samples, you can see a parent object example with OrderReport.4rp and the Office_Address Layout Node that controls the position of the child OfficeName, OfficeAddress, OfficeCity fields. Move this Office_Address element and the child elements move with it.
I mentioned earlier there is the concept of absolute or relative positioning.
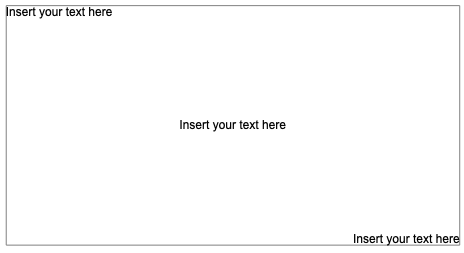
When positioning a report element by specifying X,Y values, by use of the keyword max and by changing the Anchor-X, Anchor-Y properties it is possible to position on the left/top/center/right/bottom edges of the parent report element. A good exercise is to add 3 Word Box to a LayoutNode and position them like so …
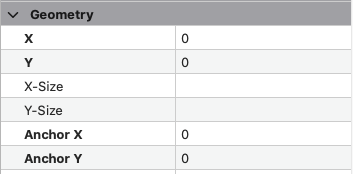
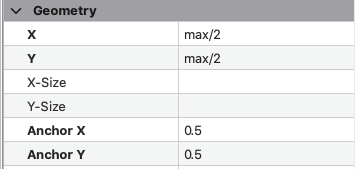
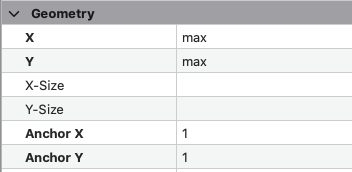
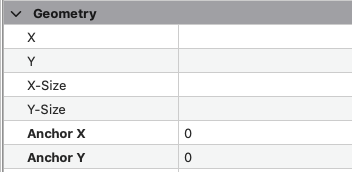
The wrong approach is to have precise numerical values in the X,Y properties. The best approach is to use the keyword max, recognise that max/2 gives you the centre, and to use Anchor-X, Anchor-Y properties to position the anchor point for the report element in the top/left/center/bottom/right of the report element. These next 3 screenshots show the Geometry properties for the 3 WordBox elements in the above screenshot.
With the above example, note what happens if you resize the parent box. The child elements will maintain their position in the top-left, center, and bottom-right positions. If the X and Y had been coded with precise values this would not occur.
The other key technique for positioning report elements involves leaving the X and/or Y properties blank. When this occurs the child report elements of a parent report element are positioned adjacent to one another.
As a simple exercise, add a Vertical Box (Layout Node) and then add 3 Word Box as children, and then in the properties view hit the Reset Value icon so that the X-Size and Y-Size properties are blank. Note how the X and Y labels is no longer bold to indicate that no value has been set. These next 3 images show the Report Design view, the Report Structure view, and the Properties view for the child elements.
This technique has the property that if the X-Size or Y-Size property changes then the younger sibling elements will have their positions adjusted. In the above quick example, if you change the Y-Size property of the second element, you should observe that the position of the third element changes.
In the above small example with relative positioning the X, Y properties are blank. When you add a report element onto a report, wether you drag the object from the Tool Box, Data View, and wether you drop it in the Design View or in the Report Structure, and wether you hold the Control key down when you drop it can all influence the initial value of properties. This is covered in the Placing Elements on the Report section of the documentation.
There are also some Advanced Properties such as LayoutDirection, Swap X, Alignment which I have not mentioned. What should be noted is that unlike what you might have learnt in maths at school, X is not always horizontal, Y is not always vertical. Pay attention in the Design view as to the directions of the X and Y arrows of a report element.
When I see blank values or values such as 0, max, max/2, this tells me some thought has gone into the report design. If I do see values and they are measured in mm/cm/in etc this tells me some thought has gone into the report design. When I see parent objects that have no viewable output (ie no background color or border), this tells me some thought has gone into the report design. But when I see no depth in the Report Structure and report elements with hard-coded precise values e.g. 123.4567, this tells me the report designer has simply dropped report elements into the report design view.


