Ask Reuben – March 25, 2020
GRW – Table As A Grid
How can I arrange multiple report objects into rows and columns?
How can I vertically arrange a number of data fields onto my report and also have a label to the left of each data field?
When using Genero Report Writer (GRW) you will often see this pattern where you want to stack a number of fields vertically and for each field you wish to display both a Label/Caption and a Value. Typically in documents such as Invoices, Purchase Order etc there will be a requirement to display values like the screenshot below …
… there are a number of techniques you can use to do this, what technique you use can have an impact on the effort required to make further adjustments. I will list a few techniques that are in my opinion are from worst to best …
Drag and Drop – Absolute
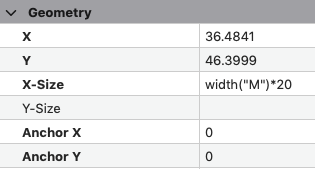
Simply drag from the ToolBox and the DataView and drop the object onto the Design View. You can tell when a designer has done this by inspecting the X and Y property of the report object. If these properties have values that look like a decimal number to some degree of precision e.g. 12.3556, 76.5123, 1.2511 then the chances are the designer has simply dropped the object in the design view in the place where they think it should go.
The problem with this technique is that the act of dropping is not precise. If the gap between adjacent rows or columns is supposed to be the same, chances are it won’t be, it will be close but not exactly the same.
Another problem is that if for some reason you decide you need to change the positioning i.e. you might have changed the size of an object by increasing the font-size or allow for more characters to be displayed, you then may have to move a number of report objects individually. You can’t change one objects property and have other objects reposition themselves automatically.
Edit Property – Absolute Values
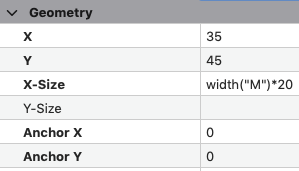
Designers recognise this weakness and so what they might then do is position the objects approximately in the right place and then they will go into the property view and adjust the property values manually so that they are the same or have the same difference.
That is if the items are stacked vertically they might adjust the Y values from 0, 31.2818, 57.0237, 88.6987 to 0, 30, 60, 90 respectively. This solves the first problem in that the gaps between each row is the same but the maintenance problem still exists. If you want to make them further apart to accomodate a larger font size, you might now have to edit each property to change the values to 0, 32, 64, 96 respectively etc.
Edit Property – Relative Value
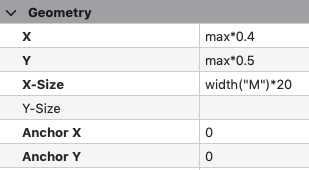
The next improvement is that instead of hard-coding values is to use relative values based on the parent object. This will involve replacing the numeric value with an expression. For X,Y properties this might be a PXML expression such as 0, max*0.25, max*0.5, max*0.75. This reduces the maintenance complexity because by resizing the parent container, then the child objects of the parent container will be positioned accordingly in the parent container.
However there is still a maintenance complexity, in that to make other changes you may have to edit multiple fields. For example to add a 5th row you will be setting the Y values to be 0, max*0.2, max*0.4, max*0.6, max*0.8.
Use of the Ctrl or Shift key to select and edit multiple properties at once can help in the maintenance effort. For example if the X property was max*0.5 for a number of objects, you could select multiple objects using the Ctrl or Shift key and change the property value to be max*0.4 and only have to type this once.
Relative Positioning
Anyone who has done report training with me will know I use the saying …
Red Dot Bad, Green Dot Good
… what this means is that instead of setting the X,Y values and using absolute positioning ( as indicated by the red dot),
… you delete the X, Y value and use relative positioning (as indicated by the green dot). With the Designer this is also achieved by dropping into the Design View whilst holding down the Ctrl key or by dropping inside the Report Structure View …
Relative positioning is good as it makes your reports easier to maintain. If you resize an object, the objects adjacent to it will be repositioned. If you have 4 objects positioned relatively as child objects of the parent, if you resize the second object, then the third and fourth objects will be moved.
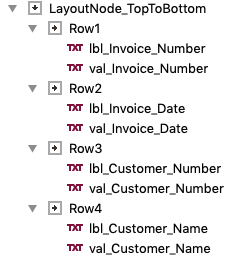
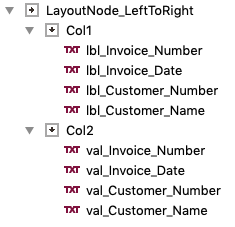
The only issue with relative positioning for a grid is how do you arrange the parents. If you have a LayoutBox (TopToBottom) that has four child LayoutBox (LeftToRight) and each of these has two objects, then your vertical positioning will be good but there is nothing keeping the horizontal position of the child objects in the second column the same in each row. In this example, the only thing keeping the val* objects aligned is if the lbl* objects all have the same X-size.
Similarly if you have a LayoutBox (LeftToRight) that has two child LayoutBox (TopToBottom) and each of these has four objects then your horizontal positioning will be good but the vertical positioning of each row will be independent in each column. That is in this example the only thing keeping the lbl* field vertically aligned with its val* field is if each lbl*, val* pair has the same Y-size.
Using a Table
The most maintenance proof technique is to use a Table.
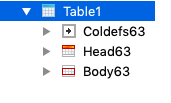
Simply drop a Table onto your report
First thing you then do is to delete the Body object and now you have by default a 3 column Table with 1 row of header.
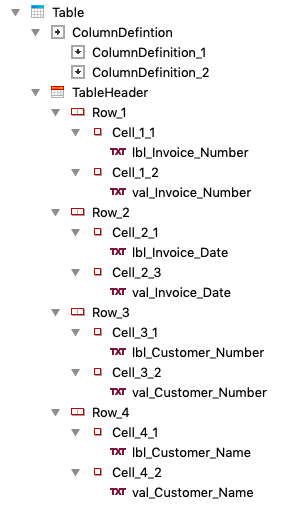
You can then amend it to have the appropriate number of rows and columns, and then in each cell of the table you place one report object.
After some renaming you will end up with something like this …
(Also review the border / rule property values)
Now no matter how much you resize the individual WordBox and other report objects in each cell, the alignment of each column and each row will be maintained.
This is why in my opinion, this is one of the better ways to handle the problem of arranging multiple report objects in columns and rows where there are no repeating elements.
For reading in the areas discussed above, have a read of …
Placing Elements on the Report Page


