Ask Reuben – December 15, 2022
Debugging
How to debug a running program?
How to debug a Web Service?
Most Genero developer would hopefully be familiar with the concept of debugging, either via the command line using fglrun -d or using the Graphical Debugger via Genero Studio. The concepts of stepping through line by line, breakpoints, watching a variable, displaying a variable value, stack frames etc. are in both and this should be no surprise, most things Genero Studio does can be done at the command line with the appropriate command. The fact Studio updates the display of multiple variables can be thought of as executing display or info many times to keep you updated. I’ll assume you know the basics and will list some things you might not be aware of.
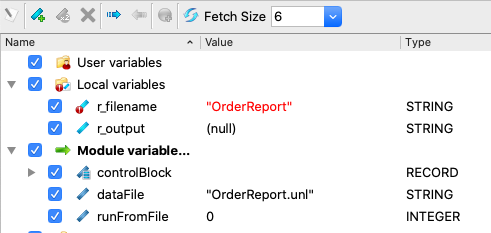
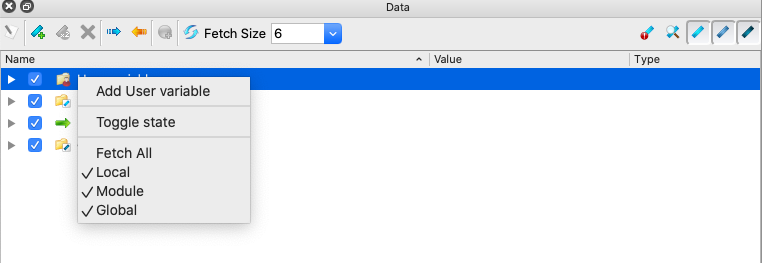
- In Genero Studio, you can use the check-box in the DataView to control what variables are updated. If you find Studio slow to step line by line, it maybe because of the volume of variables being updated. Uncheck these check-boxes. You can also right-click and unselect Fetch on Local, Module, Global, and just use the User Variables to keep the variables you are interested in being updated. (there are also buttons in the top right corner to do the same thing)
- The call function allows you to call any function in your application. It can be useful to have some debug functions already in your code. For example with this function below in your code somewhere, you can use the debugger to call this function with
call get_env("environment-variable-name")and easily see what the value of an environment variable is
    FUNCTION get_env(e STRING)
        RETURN fgl_getenv(e)
    END FUNCTION
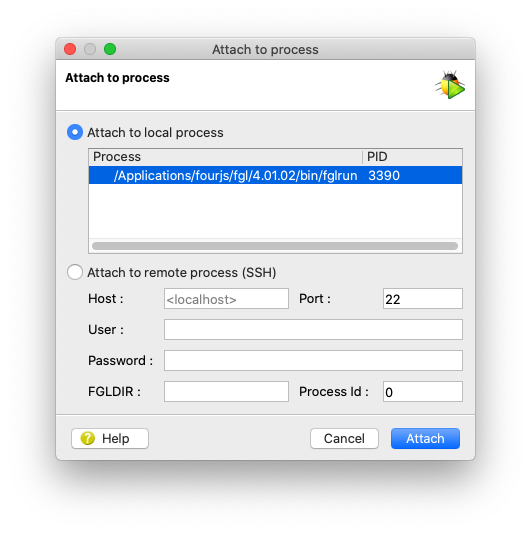
- You do not have to start a program in debug mode in order to debug it. You can attach the debugger to a running process. This is useful for debugging Web Services, debugging programs started via RUN, and Web applications you might have started by typing a URL into a browser. As long as you have the pre-requisites in place, you can attach to running program via use of
fgldb -p process-id. Or from Genero Studio using the Debug–>Attach to Process option in the Menu. Note that both techniques use FGLLDPATH and then FGLSOURCEPATH to find your sources. As an exercise, practise with the demo program in FGLDIR/demo that is started from demos.html. Set FGLSOURCEPATH to FGLDIR/demo, start the demo program from demos.html page, and note that you can use the debugger to debug the demo program.
% pwd
/Applications/fourjs/fgl/4.01.02/demo

% ps -ef | grep "fglrun"
  501  3390  3389   0  5:01pm ??         0:00.03 /Applications/fourjs/fgl/4.01.02/bin/fglrun demo.42m
  501  3254   583   0  5:02pm ttys005    0:00.00 grep fglrun

% fgldb -p 3390
30	    DIALOG ATTRIBUTES(FIELD ORDER FORM, UNBUFFERED)
(fgldb)
- it is this ability to debug a running program that also allows you to remotely debug a Genero application on another server as well as debug on a mobile device a running Genero application.
If you have not seen this ability to debug a running program, I would encourage you to give it a try.


