Debug mode
Start the Genero Desktop Client (GDC) in debug mode to access the debug functionality.
To start the GDC in debug mode, use the following
command:
gdc -DIn debug mode:
- The Debug panel is available in the Monitor.
- The Connections panel includes an option to display the AUI debug tree for an application. Right-click on the row for the application you are debugging, and select Debug Tree.
- If you use debug mode in conjunction with administrator mode (
gdc -a -D), you can copy debug information to the clipboard, including config.xml and hosts.xml content. Click About, then click the Copy to clipboard button. This enables you to send information to support when needed. - The default listening mode is
ANY(rather thanAUTOas it is in regular mode). To specify a different listening mode, use the --listen option.
Debug mode in the running application
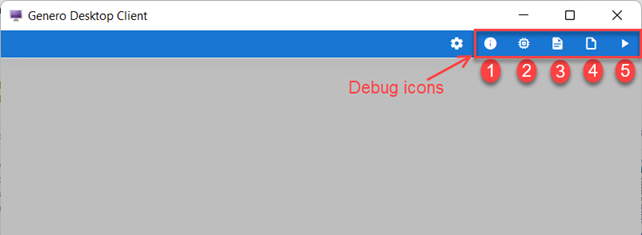
When an application is running in debug mode, the debug icons appear in the chromebar. See Figure 1.

- [Debug] AUI Tree - Opens the AUI debug tree for the current application.
- Proxy logs - Opens the current application session log in a new tab. Use this to view the status of proxies, responses sent, and system error messages. See Log files in the Genero Application Server User Guide.
- VM logs - Opens the Dynamic Virtual Machine (DVM) log for DVMs started by the application. The log opens in a new tab.
- Run in GDC - Downloads a shortcut allowing you to open the current application with the GDC.
You can activate these options within the application in debug mode:
- To activate the AUI debug tree, press Ctrl (or Command on macOS) and right-click.
- To activate the web debugger, press Alt-Shift and right-click.
- To activate the debug widget tree, press Ctrl-Shift (or Command-Shift on macOS) and right-click. The debug widget tree shows the Qt internal layout and is useful to a Qt developer.