Debug web content
You can access tools that inspect web content in your application and debug any layout and performance issues.
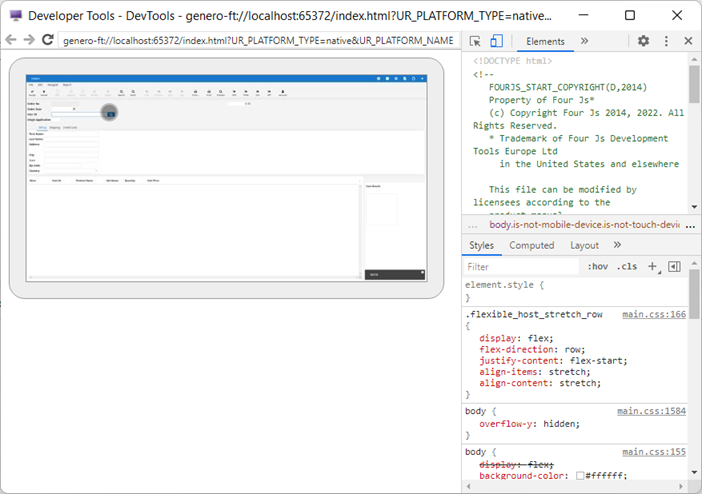
The web debugger is a debugging tool that opens in a separate window. It provides access to the QT WebEngine Developer Tools (see Figure 1). One of these tools is the inspector, which shows the HTML and JavaScript code when you click on an element or component.

If GDC is launched in debug mode, you can open the web debugger by pressing Alt-Shift and right-clicking.
The web debugger will close if the webview is closed.
Tip:
You can also configure the GDC to launch the web debugger as soon as a webview is started. See Webview in the Debug panel.
To learn more about tools for Web developers, see Chrome DevTools (external link).