- Open a new or existing report in Report Designer.
- If you are creating a new report, specify the data schema file (rdd) to be used for the report.
- From the Tool Box view, drag and drop the desired Business Graph (Map Chart, Category Chart, XY
Chart, or Pivot Table) into a container on the report design.
The Design Window will contain a Chart object and its related Item object (shown as a price tag). If you cannot view the entire chart in the Report Design window, you can re-size the display of the report in the window: point the mouse at the report and scroll the mouse scroll button while holding down the keyboard Control key.
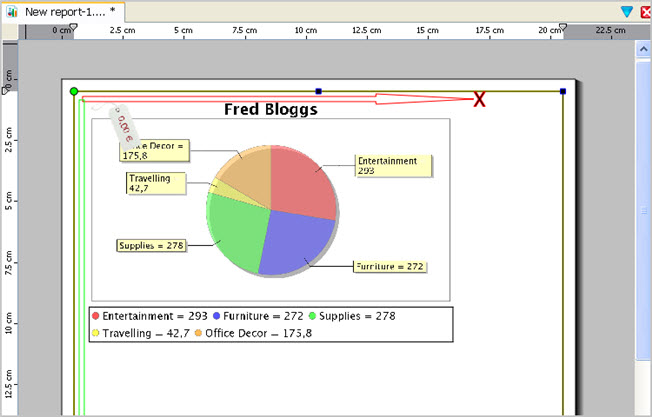
Figure 1. Chart object in the work area
- Select the chart object and enter the values for its properties in the Properties View. The properties
vary depending on the graph chosen:
- Title - caption at the top of the graph
- Values Title - caption for the values
- Keys Title - caption for the keys
- Category Title - caption for the categories (of a Category Chart)
- X Axis Title - caption for the X axis (of an XY Chart)
- Y Axis Title - caption for the Y axis (of an XY Chart)
- Draw As - the type of chart
- Sort By - sort alphabetically, numerically, or by input order.
- Sort Ascending - sort in ascending or descending order.
- Select the chart's price tag, which represents the item object, and enter values for its
properties. The specific properties vary depending on the graph type.
- keys - the data items that are used to group values, These data items must be Strings. You are not limited to existing String data items, however. You can define a custom string for the key, using the data items in a expression.
- values - the data item that contains the numbers to be charted. These data items must be Numeric.
- Modify the tree in the Structure view as needed:
- The item object for the chart ( Map Chart Item, Category Chart item, XY Chart item) must be a child of the OnEveryRow trigger node.
- The location of the chart object ( Map Chart, Category Chart, XY Chart) specifies how many different charts will be created, based on the resulting subsets of the data.
Drag and drop the nodes in the Structure view to create the correct hierarchy. If you drop a container or trigger on a different node, it will be a child of that node. Use alt-drag and it will become the parent of that node.
Examples
With Figure 2, the Structure View that resulted from the creation of a new report containing a chart. It will create a new page and chart for each data row passed to the report, and therefore needs to be modified:
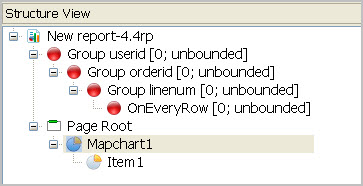
Figure 2. One chart per each row
With Figure 3, the Structure view will result in a page containing one chart; the item node is a child of OnEveryRow:
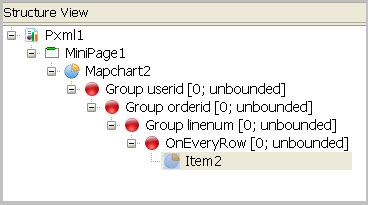
Figure 3. One chart, one page
With Figure 4, the Structure View will result in one chart for every unique userid, since the Map Chart is a child of the userid trigger node; the item node is a child of OnEveryRow:
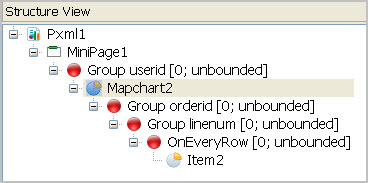
Figure 4. One chart for each unique userid