Using Grafana with Prometheus metrics
This topic explains how to use Grafana to visualize and analyze Prometheus metrics collected from Genero Application Server (GAS), GIP, FLM, OIDC, and SAML.
What is Grafana?
Grafana is an open-source analytics and interactive visualization web application. It provides charts, graphs, and alerts for the web when connected to supported data sources such as Prometheus.
Connecting Grafana to Prometheus
- Install Grafana and Prometheus on your system (refer to their official documentation).
- Start Prometheus and ensure it is scraping metrics from your Genero services.
- Log in to Grafana and add Prometheus as a data source ().
- Enter the Prometheus server URL and save the configuration.
Example Grafana dashboards and queries
- Request Rate:
rate(fourjs_gas_request_count_total[5m]) - Request Duration (90th percentile):
histogram_quantile(0.90, sum(rate(fourjs_gas_request_duration_seconds_bucket[$__rate_interval])) by (le)) - Active User Agents:
fourjs_gas_user_agent_count - Pending Requests:
fourjs_gas_request_pending_count - Failed Requests:
count(fourjs_gas_url_count_total{status!="200"})
You can create panels in Grafana using these queries to monitor system health, performance, and usage. For some examples using Grafana with these metrics, go to GAS metrics.
Setting Up Alerts
Grafana allows you to set up alerts based on Prometheus metrics. For example, you can trigger an alert if the number of failed authentication attempts exceeds a threshold, or if request latency is too high.
Example of visualizing GAS request duration histogram
To visualize the 90th percentile request duration for GAS in Grafana, use the following PromQL query in a Grafana panel:
PromQL query:
histogram_quantile(0.90,
sum(rate(fourjs_gas_request_duration_seconds_bucket[$__rate_interval])) by (le))
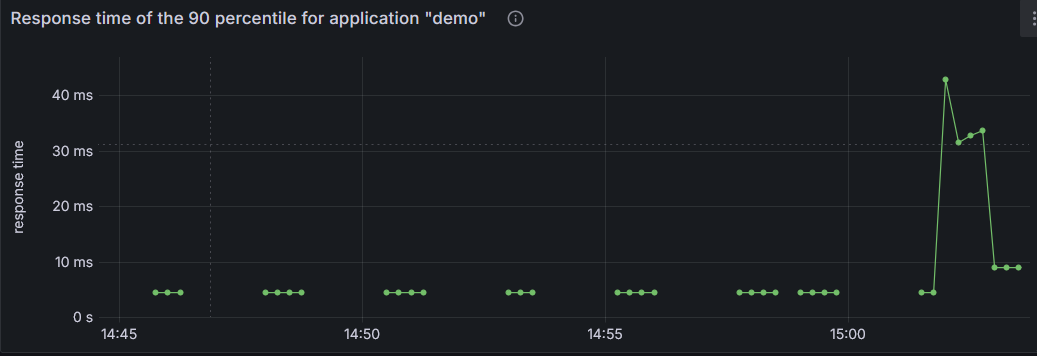
- Create a new panel and select Prometheus as the data source.
- Paste the PromQL query above into the query editor.
- Adjust the panel visualization type (for example, line graph).
- Save the dashboard to monitor request latency over time.
For more information, refer to these useful resources:
- Grafana Documentation (external link): Check out the official documentation to learn more about Grafana's features and capabilities.
- Prometheus + Grafana Integration (external link): Discover how to seamlessly integrate Prometheus with Grafana for enhanced monitoring.
- Understanding Prometheus Histograms (external link): Get a clearer picture of how Prometheus histograms work and how to use them effectively.