Monitoring the GAS with Prometheus
The Genero Application Server provides monitoring and alerting capabilities through integration with the open-source Prometheus telemetry standard. Prometheus is a widely-used solution for collecting and analyzing metrics from infrastructure, applications, and services.
Key features of Prometheus include:
- Time series storage: Stores metrics as time series data, enabling you to track changes over time.
- Flexible metric naming: Metric names and labels help you group and filter data for easier analysis.
- HTTP endpoint scraping: Collects metrics by regularly scraping designated HTTP endpoints, ensuring you have up-to-date information.
- Alerting mechanisms: Supports alerting rules that notify you when specific metric conditions are met.
- Visualization tools: Integrates with tools (such as Grafana for dashboarding) to help you to visualize metrics.
Prometheus integration with GAS
Prometheus integration with GAS enables monitoring of Genero server components across cloud and on-premises environments.
Key benefits include:
- Real-time performance monitoring: Monitor application performance and availability continuously.
- Runtime state tracking: Observe system state to ensure smooth and reliable operation.
- Built-in metrics access: Leverage a wide range of default metrics for Genero applications and services. For details, go to Supported metrics.
- Custom monitoring options: Extend monitoring with application-specific metrics using
the
fglprofileoption and the BDL Prometheus API.
Prometheus use cases
Prometheus supports practical monitoring across your Genero environment:
- Infrastructure health monitoring: Monitor key components (GAS, dispatchers, proxies, DVM) to detect issues early.
- Application lifecycle tracking: Track application and web service startup and shutdown events by enabling Prometheus at DVM startup.
- Default and custom metrics access: Access built-in metrics via GAS, and extend monitoring with custom metrics using the BDL Prometheus API. For more information on creating custom metrics, refer to the The prometheus package section of the Genero Business Development Language User Guide.
- Service observation: Monitor services (like Genero Identity Provider, OpenIdConnectServiceProvider, SAMLServiceProvider) to ensure proper operation.
Prometheus architecture
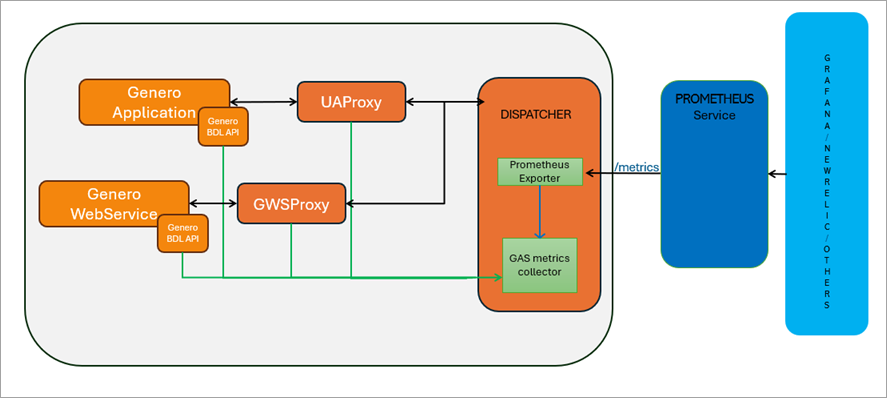
- Genero application: Generates runtime metrics for Genero applications.
- Web services: Generates runtime metrics for Genero web services.
- Proxies: UAProxy and GWSProxy generate metrics.
- Dispatcher: Aggregates metrics from proxies and runtimes. It is the configured endpoint for Prometheus scraping.
- Prometheus service: Scrapes metrics from the dispatcher and stores them in a time-series database for visualization and alerting.
- Visualization and alerting: Enables analysis and dashboarding of stored metrics, with support for alerting based on defined conditions.
Setting up GAS for Prometheus
To integrate Prometheus with GAS, follow these steps:
- Configuration: Configure GAS and your BDL applications and services to enable metrics collection. For details, go to Configure GAS for Prometheus.
- Prometheus server setup: When setting up the Prometheus server, consider the following
guidelines for implementation within your network:
- Server placement: You can run the Prometheus server on the same machine as the GAS for smaller deployments or testing environments. However, for production environments, it is generally recommended to run Prometheus on a separate machine. This separation helps to ensure that the monitoring system does not impact the performance of the applications being monitored.
- Cloud GAS considerations: If you are using GAS in a cloud environment, you can deploy the Prometheus server on a local machine or a dedicated virtual machine in the cloud. Ensure that the Prometheus server can access the GAS instances over the network. You may need to configure security groups or firewall rules to allow traffic between the Prometheus server and the GAS instances.
- Configuration file: Download the latest release from the Prometheus website.
Extract the files and create a
prometheus.ymlconfiguration file. For details of configuring Prometheus to gather GAS metrics, go to Configure Prometheus to gather GAS metrics. - Starting the server: Start the Prometheus server using the command:
./prometheus --config.file=prometheus.ymlOn a standalone dispatcher, you can access the Prometheus metrics at http://localhost:6394/metrics to verify that it is configured correctly.Warning:Ensure that access to
http://localhost:6394/metricsis restricted to prevent unauthorized scraping. For example, bind the service to localhost, use a firewall rule, or place the endpoint behind a reverse proxy with authentication or TLS.
- Visualization tool installation: While Grafana is a popular choice for visualizing
Prometheus metrics, there are other options available as well. You can consider tools like:
- Grafana: Grafana is one of the most popular visualization tools for Prometheus. It provides powerful dashboarding capabilities and allows you to create custom visualizations based on Prometheus metrics. For more information, go to Using Grafana with Prometheus metrics
- Chronograf: Chronograf is part of the TICK stack (Telegraf, InfluxDB, Chronograf, Kapacitor) but can also be used to visualize data from Prometheus. It offers a user-friendly interface for creating dashboards and visualizations.
- SigNoz: SigNoz is an open-source observability platform that supports Prometheus as a data source. It provides a comprehensive solution for monitoring applications and infrastructure, allowing you to visualize metrics collected by Prometheus.
- Redash: Redash can connect to various data sources, including Prometheus. It allows you to create visualizations and dashboards based on the metrics stored in Prometheus, making it a flexible option for data visualization.