The Genero Web Client for JavaScript (GWC-JS) interface provides debug options for troubleshooting applications.
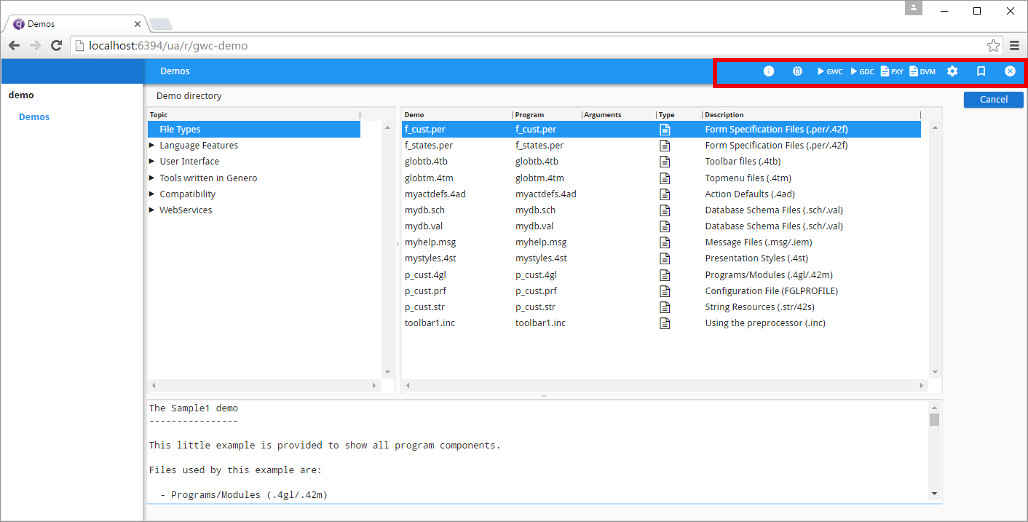
Figure 1. GWC-JS user interface debug icons
Running a GWC-JS app in debug mode
Debug mode can be activated by:
- Configuring the Genero Application Server to run in development mode with the --development flag. This enables debug mode for all launched applications. See Configure development environment.
- Adding the query string parameter "debugMode=1" to the URL. For example: http://localhost:6394/ua/r/HelloWorld?debugMode=1
- Typing "gbc.DebugService.activate()" in the browser JavaScript console. The JavaScript console is provided by Web browsers as part of their developer tools. Once activated, the application remains in debug mode until the browser is refreshed.
Debug Icons
When the GWC-JS is running in debug mode, the debug icons are displayed along side the standard
icons in the toolbar (see GWC-JS application page). Hovering your mouse
over the icons shows text that describe their function.

Figure 2. Debug icons
- Debug Tools
- The Debug tools icon opens the AUI tree for the current application. See View the AUI tree.
- GWC
- The Run in GWC-HTML5 icon opens the current application with the wa protocol. The application opens in a new tab.
- GDC
- The Run in GDC icon downloads a shortcut allowing you to open the current application with the Genero Desktop Client.
- PXY
- The Proxy Logs icon opens the current application session log in a new tab. Use this to view the status of proxies, responses sent, and system error messages. See Logging.
- DVM
- The VM Logs icon opens the Dynamic Virtual Machine (DVM) log for DVMs started by the application. The log opens in a new tab.