Replay a GBC log
With the GBC, you can record a session log to capture the interaction between the front-end and the DVM, with the intent of using that log later to replay the session for debugging purposes, or to provide a demo of the application. A log can also be useful when reporting a support case.
Display the log player
To display the log player, open the application and include the
logplayer query string parameter in the application URL, with the value set to
1. For example, open the demos application by
entering the URL for your GAS in a browser:
- GAS 5.00 and greater
-
http://localhost:6394/ua/r/demo?logplayer=1 - GAS prior to 5.00
-
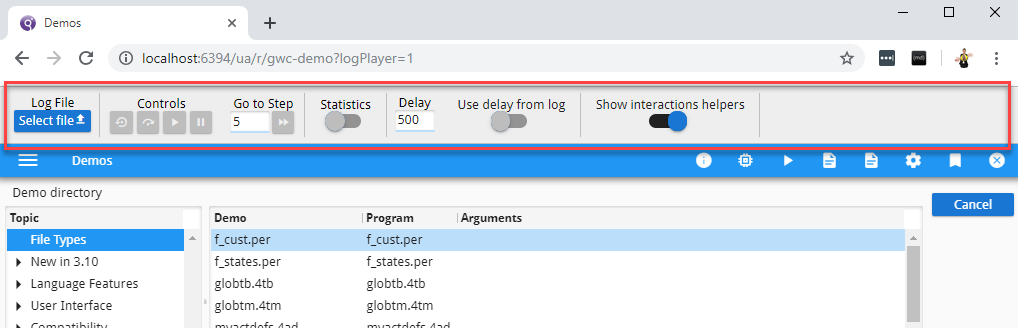
http://localhost:6394/ua/r/gwc-demo?logplayer=1
The replay takes into account the size of the browser window when the log was recorded. The log is replayed in the same context it is recorded, to avoid having differences when trying to reproduce a potential issue. As a result, you may find that you need to scroll or resize your browser window when replaying a log.
Log player controls
The log player displays above the application.
Log file
To load a log file, click Select file and select the session log.
When the session log is loaded, an informational page displays with details about the environment at the time the session log was recorded. It displays the filename, GBC details (version, theme used, and so on), browser details (type, OS, and so on), the settings of every theme variable at the time the session log was recorded, and the values of the stored settings.
You can also hover over the Select file button to view information about which log file has been loaded.
Controls / Go to Step
The four buttons under Controls do the following:
- Reset - Start from the beginning.
- Next Step - Step through the log one step at a time.
- Play - Play the log, moving between steps as defined by the Delay section (see below).
- Pause - Pause the replay of the log.
The Go to Step field allows you to skip to a specific step. Enter in the step number and click the double-arrow icon.
If you pause the log replay, you can interact with the application interface; however you are not truly interacting with the application as there is no DVM. When you resume the log replay, it picks up where it stopped, ignoring any of the clicking you have done in the interface.
Statistics
The Statistics switch allows you to enable or disable statistics. If you enable statistics, you can get information about the DOM state and the number of widgets remaining in the application at the end of the log. The statistics displayed are not intended for analysis by the casual user; they are mainly provided for use by support, to provide information that may be useful when investigating performance issues or checking for memory leaks.
Delay / Use delay from log
By default, the Use delay from log switch is in the ON position, meaning that the timestamps recorded in the session log are used to determine when to move from one step to the next. The replay will happen following the same timings that the user took when recording the log.
The Delay field allows you to specify, in milliseconds, the time between steps when replaying a log. The delay interval is only used when the Use delay from log switch is OFF.
Show interactions helpers
The Show interactions helpers shows the user interactions that may not appear on the application itself. For example:
- Mouse movement and mouse clicks
-
While you can follow the mouse movements in the application interface, you need more information to determine whether the right or left mouse button has been clicked. The right and left arrows that display in the interactions helpers section tell you whether the user clicked the left or right mouse buttons. Touch events, middle click, and mousewheel events are not displayed here.
In Figure 2, the mouse is being used but there is no mouse click.
Figure: Mouse used, no click 
In Figure 3, the mouse is being used and the left mouse button has been clicked. When a left or right mouse button is clicked, the arrow becomes stronger and is more pronounced.
Figure: Mouse used, left button clicked 
- Key strokes and data entry
-
When you are looking at the application interface, the keys that the user presses are not shown. This includes the data that the user may be entering into a field. You can, however, see what keys the user pressed by looking at the interaction helpers. Key combinations are displayed.
In Figure 4, the user was in a field when they pressed the
2key:Figure: User pressed 2 
In Figure 5, the user pressed the RETURN key:
Figure: User pressed RETURN 