Map charts
The map chart allows you to create a graph that has one set for values to be mapped, grouped together by a specific key.
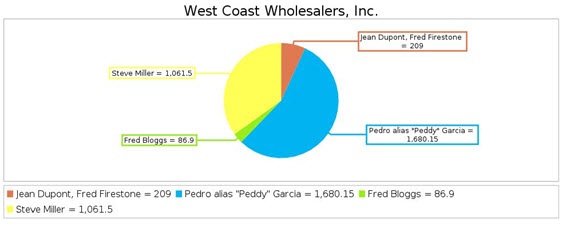
The chart is defined by the Map Chart object. The key and value are defined in the Map Chart Item. For example, the pie chart in Figure 1 presents the total revenue (the value) for each customer (the key), based on the OrderReport.rdd file in the Report Writer sample programs.
The default map chart is the pie chart. You can use the Draw As property to produce other types, including 3D pie, bar, and ring. Map charts can also be output as tables.
Example
The OrderReport demo application contains examples of reports using map charts.