Modify the report structure for business graphs

When you add a business graph (map chart, category chart, or XY chart) to your report, the chart and its chart item are added to your report structure. You need to modify this report structure to ensure that your business graph displays correctly.

  1. Open a new or existing report in Report Designer. If the business graph does not exist, create it. See Create a map chart, Create a category chart, or Create an XY chart.

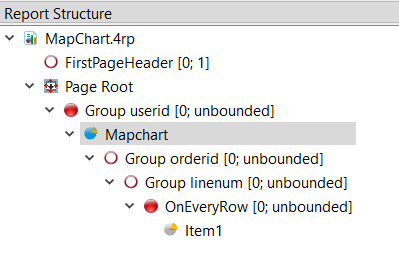
    The Report Structure view shows the position of the chart and the chart items. When a business graph is created, the structure displays as in Figure 1. It creates a new page and chart for each data row passed to the report, and therefore needs to be modified.

    Figure: One chart per each row
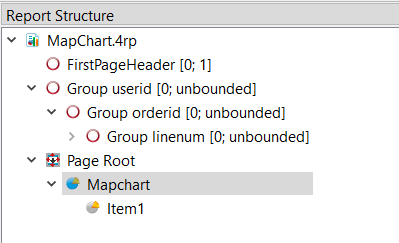
    This figure shows a Mapchart Item under the Mapchart object node under PageRoot.
  2. The location of the chart object (map chart, category chart, or XY chart) specifies how many different charts are created, based on the resulting subsets of the data. Drag and drop the chart object to the desired location in the hierarchy.
    Tip: If you drop a container or trigger on a different node, it becomes a child of that node. Use Alt-drag and it becomes the parent of that node.
  3. The item object for the chart (map chart item, category chart item, or XY chart item) must a child of the node where the value changes, typically the OnEveryRow trigger node. Drag and drop the chart item object to the node.
  4. Save the report.

Examples

In Figure 2, the Report Structure view results in a page containing one chart; the item node is a child of OnEveryRow.

Figure: One chart, one page

This figure shows a Mapchart Item under the OnEveryRow trigger node in the Report Structure View. This structure results in a single page report with one chart.

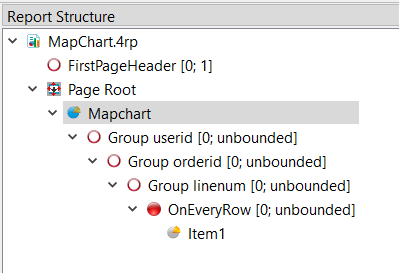
In Figure 3, the Report Structure view results in one chart for every unique user id, because the Map Chart is a child of the user id trigger node and the item node is a child of OnEveryRow.

Figure: One chart for each unique userid

This figure shows a Mapchart object under the userid trigger node, and a Mapchart Item under the OnEveryRow trigger node in the Report Structure View. This structure results in a Map Chart for each userid.