XY charts
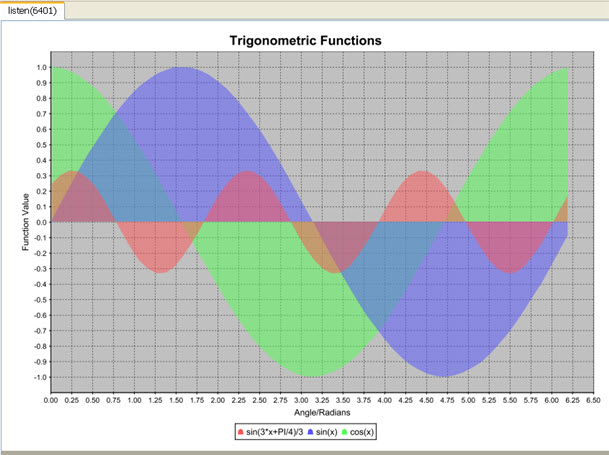
The XY chart allows you to create a graph that maps a series that has two values, as an XY-plot.
The chart is defined by the XY Chart object. The values for the X and Y axis are defined by the XY Chart Item. This chart is used most often for scientific data.

The default XY chart is the line chart. You can use the Draw As property to produce other types, including area, polar, scatter, step, and time series. XY charts can also be output as tables.
Example
The Reports demo contains an example report that uses an XY chart.