Explore the Debugger

Follow these steps to explore Debugger features.

Before you begin: You must have opened and built the OfficeStore project.

  1. Expand the Intermediate Files folder in the Account_prg node and doubleclick Account_prg.4gl to open the source in Code Editor.
    Figure: The Account_prg application in Code Editor

    This figure shows the open Account_prg.4gl application.
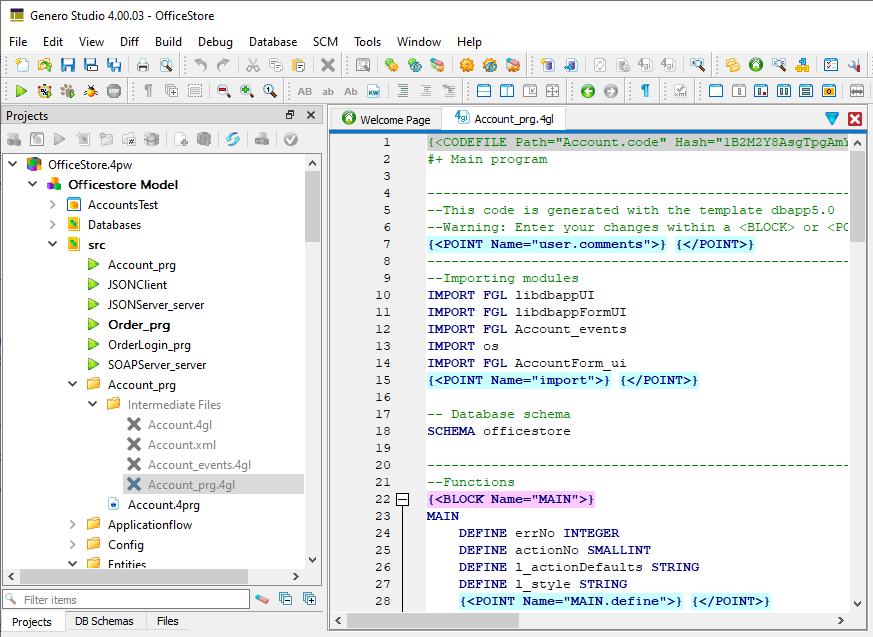
  2. Right-click on the function call to Account_openFirstForm() (approximately line 50) and select Add/Delete Breakpoint.
    A red dot, the breakpoint icon, appears in the gutter adjacent to the line of code.
    Figure: Adding a breakpoint

    This figure shows a breakpoint at line 50 of the Account_prg.4gl application.
  3. In the Code Structure view, expand the MODULE AccountForm_ui node and locate the AccountForm_ui_uiOpenForm() function.
  4. Click on the function in the Code Structure view to locate it in the source code.
    The module (AccountForm_ui.4gl) opens in the Code Editor.
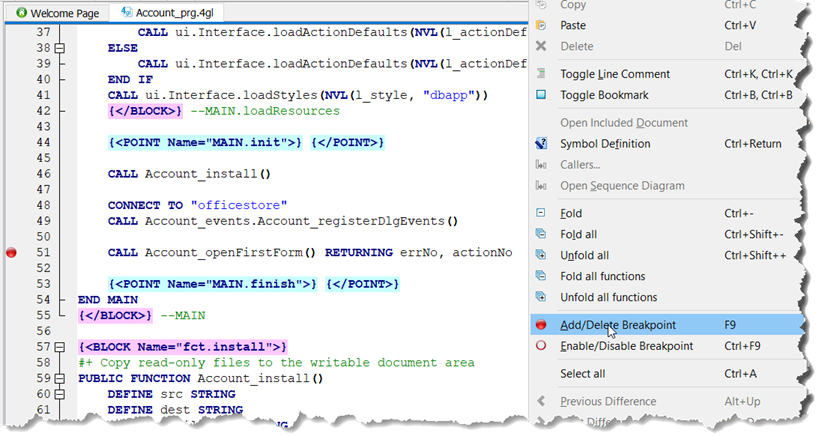
  5. Set a breakpoint at the AccountForm_ui_uiOpenForm() function header.
    The Code Structure view is updated to display variables, additional functions, and imported source modules of the AccountForm_ui.4gl module.
    Figure: Module variables and functions

    This figure shows the Code Structure view for the AccountForm_ui.4gl module, displaying the variables, additional functions, and imported source modules.
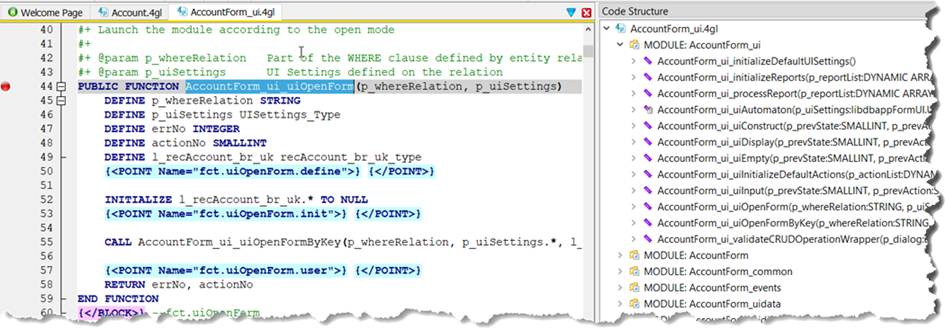
  6. Close the AccountForm_ui.4gl source module, right-click the Accounts_prg configuration node, and select Debug.
    The application runs in debug mode and stops at the first breakpoint.
    Figure: Waiting at a breakpoint

    This figure shows the Accounts application in Debug mode, waiting at the breakpoint for Account_openFirstForm.
  7. Select Debug > Continue to continue program execution.
    The program opens the AccountForm_ui.4gl source module and stops at the breakpoint on AccountForm_ui_uiOpenForm().
  8. Select Debug > Next to step through the program until you reach the function call to AccountForm_ui_uiOpenFormByKey().
  9. Select Debug > Step in to execute the function call and scroll to the function source in Code Editor.
    The program stops at the first line of executable code in the function and waits.
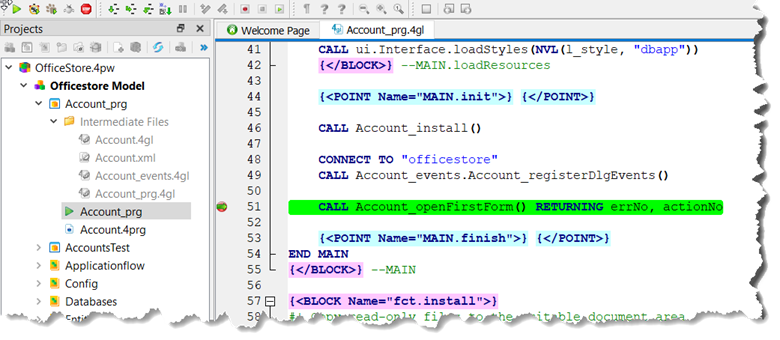
  10. Set breakpoints for the following two functions (use the Code Structure view to locate them) in AccountForm_ui.4gl.
    • AccountForm_ui_uiDisplay()
    • AccountForm_ui_uiInput()
    Figure: Setting breakpoints

    This figure shows the Code Structure for AccountForm_ui.4gl, and highlights the AccountForm_ui_uiDisplay and AccountForm_ui_uiInput functions.
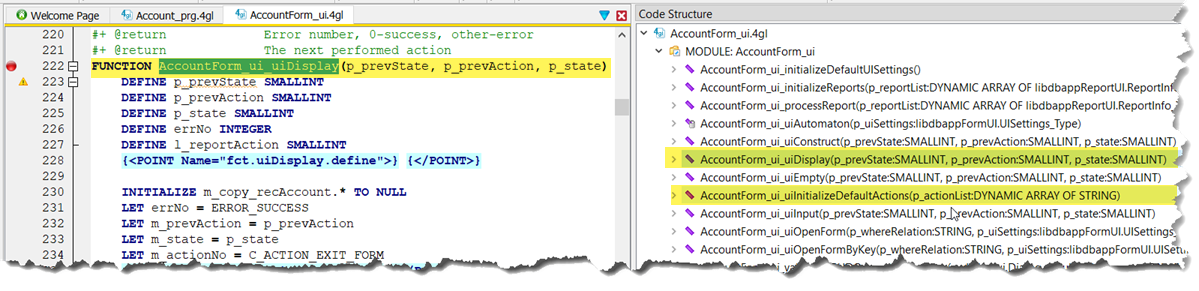
  11. In the Data view, locate the Module variables for the AccountForm_uidialog module. Expand the m_uiSettings record to view the record members, then right-click on openMode and select Add to watch.
    Figure: Setting a watchpoint

    This figure shows a watchpoint being added for the m_uiSettings.openMode variable in the AccountForm_uidialog module.
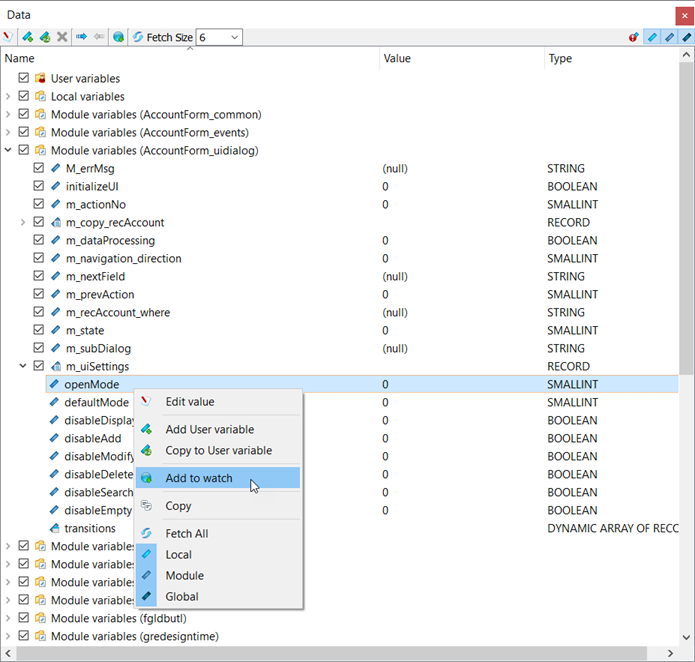
    Program execution will stop each time the m_uiSettings.openMode variable changes.
    Tip: Increase the visibility of m_uiSettings.openMode by adding it to the user variables. Right-click on openMode and select Copy to User variable. Now you can monitor the variable at the top of the Data view in User variables.
  12. In the Command view, type continue and press the Enter key.
    Figure: The Command view
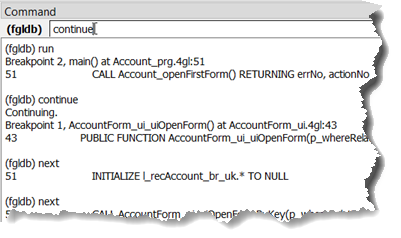
    The figure shows the Command view with the "continue" command entered.
    Entering the continue command resumes program execution until the watchpoint on m_uiSettings.openMode triggers.
  13. Select Debug > Continue twice.
    An application screen displays and program execution stops.
  14. Select Debug > Interrupt to temporarily return control to the Debugger and scroll to the current line of code, a dialog statement.
  15. Use the Backtrace view to see which functions in the program have been called.
    Figure: The Backtrace view
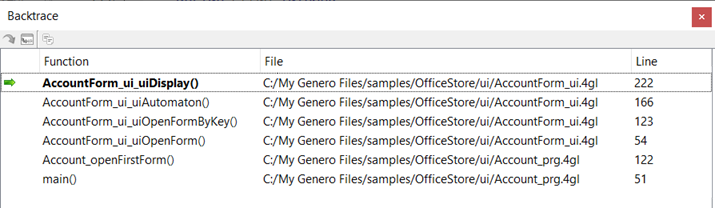
    The Backtrace view in this figure shows that the current function is AccountForm_ui_uiDisplay() which was called from AccountForm_ui.4gl.
  16. Select Debug > Continue.
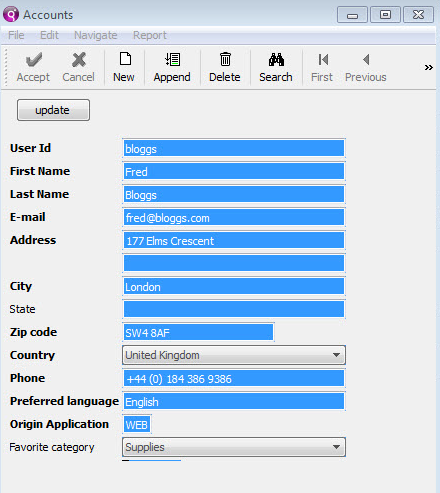
    Program execution switches control back to the application screen, which appears the same as if it were running outside the Debugger.
    Figure: The application screen

    This figure shows the Accounts screen from the application displayed during the debugger session.
  17. Interact with the program:
    1. Select Search in the Accounts window
    2. Type miller into the Last Name field and click Accept.
      Control switches back to the Debugger and program execution continues until it reaches the breakpoint at function AccountForm_ui_uiDisplay().
    3. Select Debug > Continue to continue program execution until the record for user Miller displays and control switches back to the application screen
    4. Select File > Exit to close the application screen and terminate the application.
      Terminating the application also terminates the Debugger session.