Modify the report structure
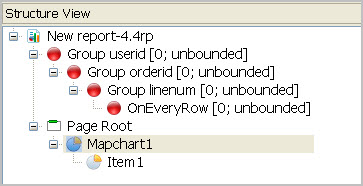
When you add a business graph (map chart, category chart, or XY chart) to your report, the chart and its chart item are added to your report structure. You need to modify this report structure to ensure that your business graph displays correctly.
Examples
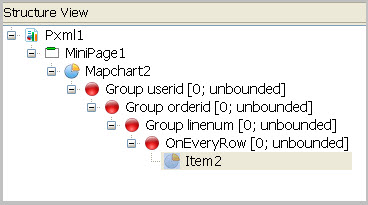
With Figure 2, the Structure view results in a page containing one chart; the item node is a child of OnEveryRow:

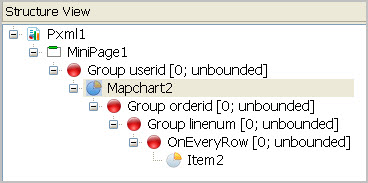
With Figure 3, the Structure View results in one chart for every unique user id, since the Map Chart is a child of the user id trigger node and the item node is a child of OnEveryRow:

