Using the Reports demo
The Reports demo contains examples to show how the components of a report application fit together. Study these examples to learn how to build your own report design documents and report programs.
When Genero Studio launches, the Welcome Page lists the demo projects. Select Reports to open the Reports demo project in Genero Studio.
The Reports demo project consists of:
- Application files, generated or written using Genero Business Development Language.
- A set of report definition files, created with the Genero Report Designer.
- The data schema for the database used with the demo reports.
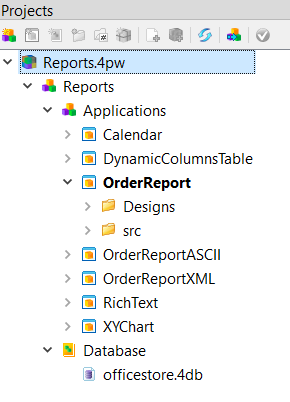
Most of the design and source files are contained under the OrderReport application. The OrderReport reports are listed in Table 1.
| Report Name | Description | See Also |
|---|---|---|
| CategoryChart* | Several examples showing a category chart, or a chart that is grouped by two fields. These examples show how different charts can be produced from the same data. | Category charts |
| Dashboard report | A report displaying a dashboard that includes two business graphs and a table. It demonstrates business graphs and pivot tables. | Working with business graphs, Working with pivot tables |
| Dynamic Pivot Table | A report that allows you to select which fields to use as dimensions (for grouping) and which fields to include as measures. Generates a table of user-selected measures, grouped by user-selected dimensions. | Sample pivot table reports |
| Fancy Pivot Order List | A report displaying an order list grouped by countries and product lines. It uses the Grouped List with Totals template. It demonstrates regrouping, aggregations, and running totals. | Create and manage report templates, Report schema transformations |
| Generic List | Generic list report using a FLAT LIST type that allows you to select the fields to include. Generic reports are created at runtime and do not have a report design document. | Generic reports |
| New Generic List | Generic list reports using a NEW LIST type that allow you to select the fields to include. | Generic reports |
| Grouped Table Demo | A report in table format. This report shows a table with several header and body rows. | Table |
| List Demo | A report in list format that includes images, totals, and conditional text coloring. This report provides two examples of RTL expressions that control the font color and the "thumbs-up/thumbs-down" image at runtime, based on a field value. | Change the display based on a condition |
| MapChart* | Several examples showing a map chart, or a chart that is grouped by one field. These examples show how different charts can be produced from the same data. | Map charts |
| MasterReport | A report that links to other sub reports. | Creating master report design for linked reports |
| MasterReportInlined | A report that includes inline sub reports. | Merging report schema for inline reports |
| OrderLabels | A report consisting of pages of mailing labels for customers. It demonstrates the independence of the label design from the layout of the physical labels on the paper. | Create labels: the report program (Genero BDL), Design labels |
| OrderList | A report showing a text-based list, based on the list template. It illustrates the use for layout-dependent references. | Print a layout-dependent reference (Info Nodes) |
| OrderReport | A report detailing a customer order. This report illustrates the use of different page headers and footers on each page, and includes an OMR Bar Code. | Add headers and footers to a report |
| OrderStock | A report displaying stock information, including a code-39 bar code. This report illustrates the use of attachment and positioning rules, and shows you how to design a report onto a form or pre-printed paper using a background image. | Design documents for pre-printed forms |
| PivotOrderList | A report displaying revenue disribution by customer in a pivot order list. It demonstrates regrouping and aggregations. | Report schema transformations |
| RevenueAnalysis | A report that analyzes the revenue by area, category, and customer. It demonstrates duplication of data. | Report schema transformations |
| StaticPivotTable | A table of customer data, grouped by customers and orders. | Sample pivot table reports |
| TableDemo | A report in table format. This report shows a simple usage of a table. It also shows how to hide values that occur more than once. | Table, Hide repeated values |
To view these reports, run the Reports demo.
To view the code, open the OrderReport.4gl file in the src directory of the OrderReport application.
Other report applications
Other reports are in their own application directories, which contain both design and code files. These reports are listed in Table 2.
| Report Name | Description | See Also |
|---|---|---|
| Calendar | Uses a table to display a work calendar. | |
| Dynamic Columns Table | Displays a table that creates columns dynamically based on data. | |
| Order Report ASCII | Displays a Genero ASCII (compatibility) report. | Running a Genero ASCII report using GRW (compatibility report) |
| Order Report XML | Fetches report data from an XML file and displays it in a report. | Fetching report data from an XML file |
| Rich Text | Displays the content of a Web Component using a Rich Text Box. | Rich Text Box |
| XY Chart | Displays an XY Chart showing trigonometric functions. | XY charts |
To view these reports, right-click on the application node and select Execute.