Explore the Debugger
Follow these steps to explore Debugger features.
- Expand the Intermediate Files folder
in the Accounts node and double-click Account.4gl to
open the source in Code Editor.
Figure: The Account application open in Code Editor 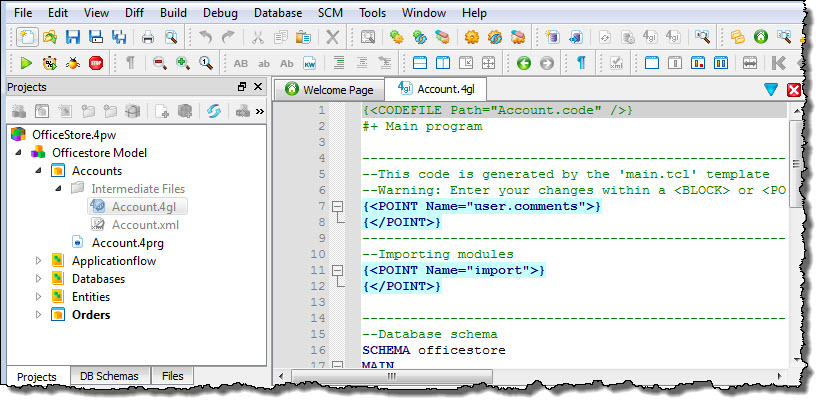
- Right-click on line 33, a function call to
AccountForm_ui_uiOpenForm()and select Add/Delete Breakpoint.A red dot, the breakpoint icon, appears in the gutter adjacent to line 33.Figure: Adding a breakpoint 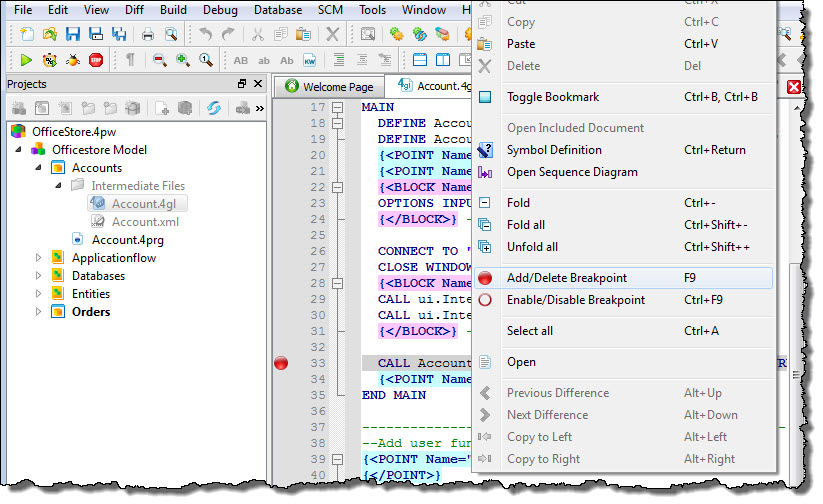
- Right-click the Accounts application node and select Debug to
start the application in Debug mode.When the application runs, it stops at the breakpoint, and waits.
Figure: Waiting at a breakpoint 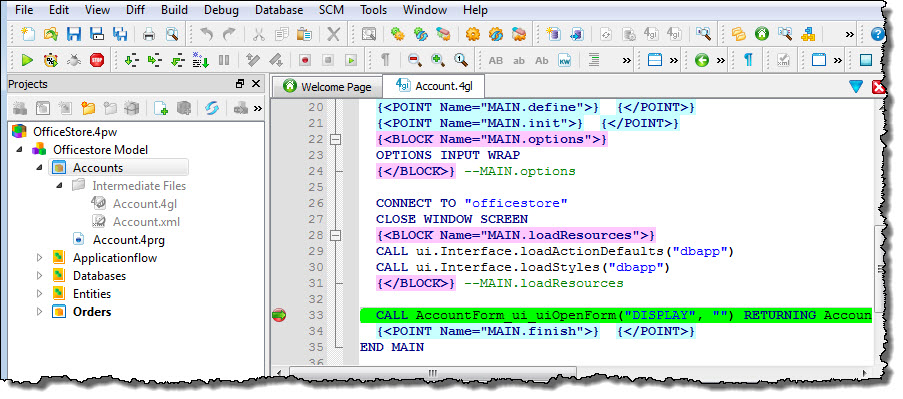
- Select to execute the function call and open the function module,
AccountForm_ui.4gl, in Code Editor.
Execution stops inside the called function, waiting for the next Debugger instruction.
Figure: Stepping into an external function 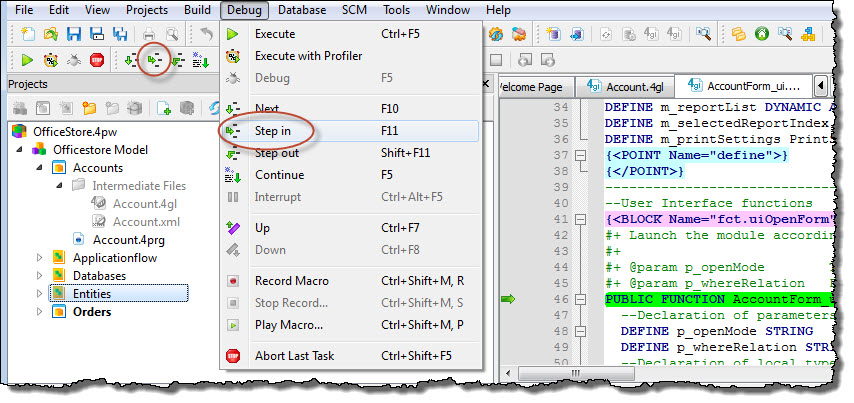
- Use the Code Structure view to quickly locate functions in
AccountForm_ui.4gl for additional breakpoints:
- In the Code Structure view, select the
AccountForm_ui_uiDisplay()function to display the function source in Code Editor. - In Code Editor, right-click on the line containing the function header and select Add/Delete Breakpoint.
- Repeat Sub-steps a and b to create a breakpoint for
the
AccountForm_ui_uiInput()function.
Figure: Navigating functions using the Code Structure view 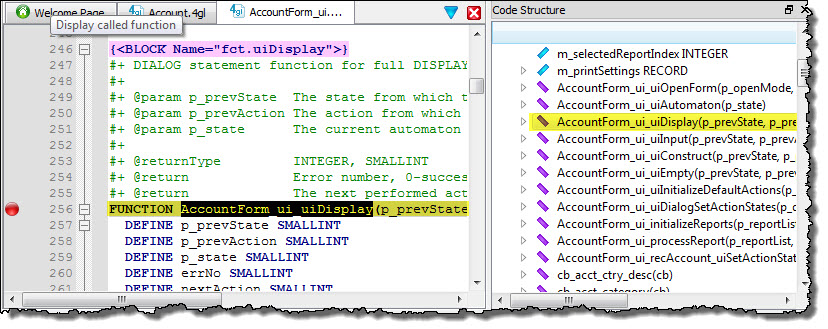
- In the Code Structure view, select the
- In the Data view, expand the Local variables
folder, right-click on the variable p_openMode, and select
Add to watch.Setting a watchpoint on the p_openMode variable will stop program execution each time the variable value changes.
Figure: Adding a Watchpoint 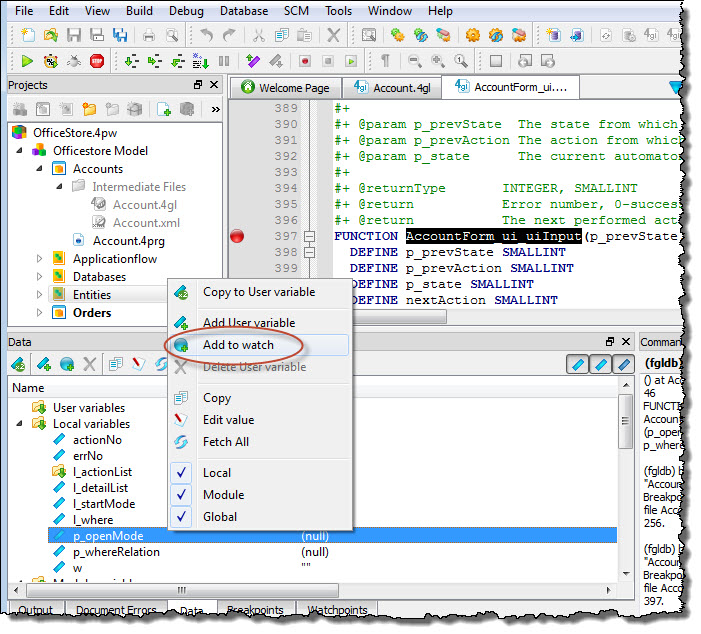
- In the command line area of the Command view, type
continue to resume program execution until the
p_openMode watchpoint is triggered.Entering the continue command resumes program execution until a breakpoint is reached, a watchpoint is triggered, or the program terminates. The continue command is also available in the Debug menu and Toolbar.
Figure: Command view showing the results of the continue command 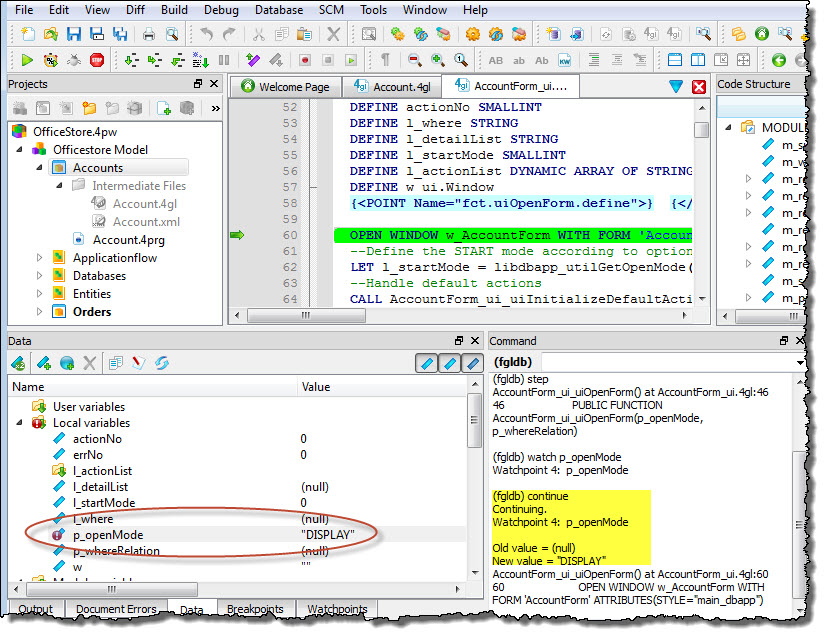
- Use the Backtrace view to see which functions in the program have been
called.
Figure: The Backtrace view 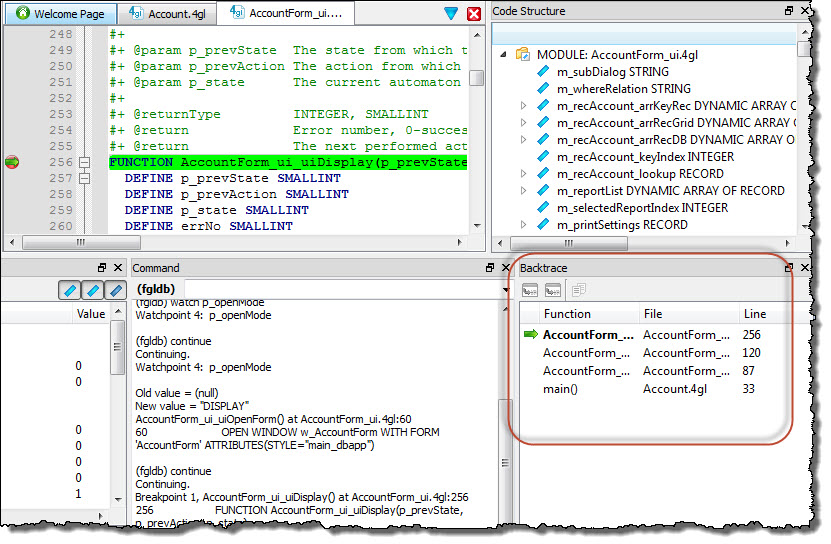
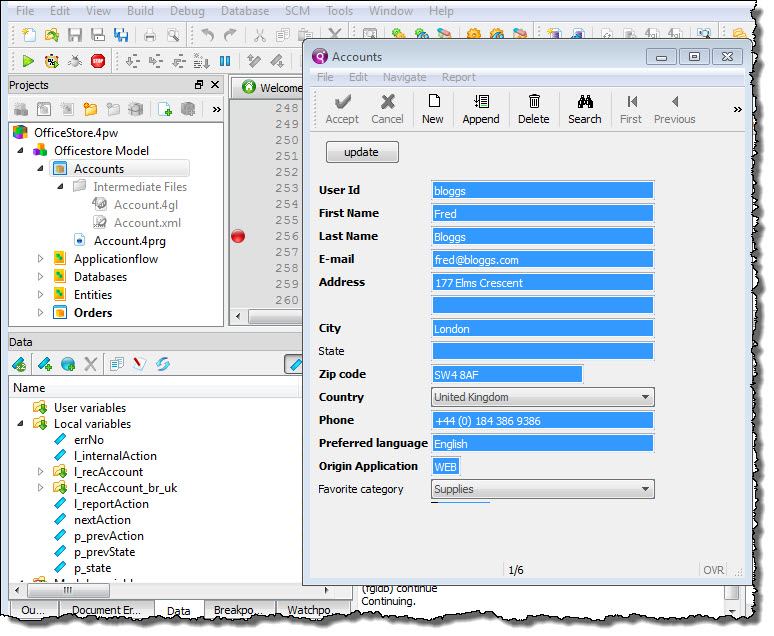
- Select .Program execution continues until an interactive Dialog statement (
DISPLAY
ARRAY
) switches control to the application screen, which appears exactly as if it were running outside the Debugger.Figure: The application screen