Specifying classic or default style
The business graphs use a "flat design" by default, but you can change this to use the more 3D "classic" design. You can also choose between three different color schemes.
Two drawing styles are available for business graphs:
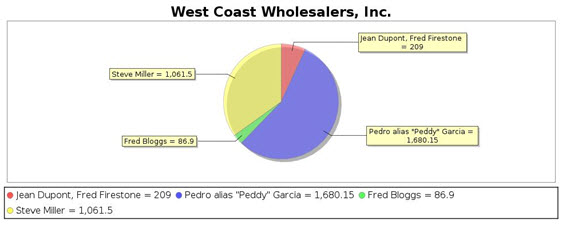
- classic – the classic drawing style used by earlier versions of Genero Studio.
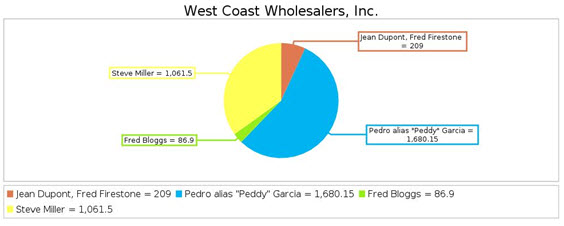
- default – the newer drawing style. This is a "flat design" using fewer shadows, 3D effects, and gradients than the classic style.
If no drawing style is specified, the default style is used.
Three color schemes are available for business graphs: JF, FV and D3. JF is the default scheme for the classic drawing style and FV is the default scheme for the default drawing style.
Use the fgl_report_setRenderingHints function with the pxmlChartStyle hint to specify the style and color options. The style options are passed as a comma-separated list of styles. For example, the following code selects the original drawing style using the D3 color scheme:
DEFINE renderingHints om.SaxAttributes
LET renderingHints=om.SaxAttributes.create()
CALL renderingHints.addAttribute("pxmlChartStyle","classic,D3")

CALL fgl_report_setRenderingHints(renderingHints)
Examples