The work area
The work area in the Main Window provides a GUI interface to the report.
Figure: Report Designer work area
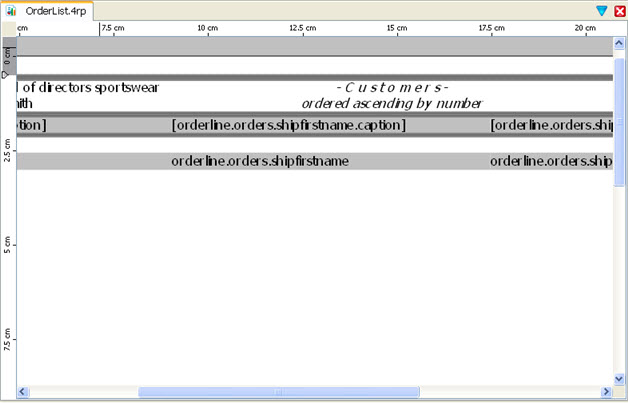
You design a report by initially dragging and dropping containers (such as such as Mini Pages and Layout Nodes) from the Tool Box view into the work area, stacking and arranging them to create the report page. Next, report elements such as Word Boxes, Decimal Format Boxes, and Image Boxes are dragged and dropped into the containers.
From the Data View, if you have specified the data schema, you can drag and drop data values into a container.
Page headers and footers can also be defined.
When you select a report element in the work area, its properties are listed in the Properties view. In the Properties view, you can change a property value. For example, a Word Box has a text property where you can enter text to be displayed in the report.
If you select multiple elements, all items in the current selection are affected by the current operation, such as moving, sizing, or changing the type or text.
Figure: The Toggle View icon

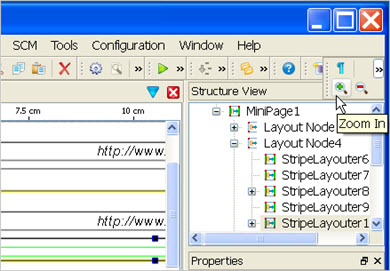
Zoom buttons on the Toolbar allow you to zoom in and out on the report design document.
Figure: Zoom buttons