Excel report output
As with all output formats, the layout of the cells (size, font color, etc.) in an XLS or XLSX report are controlled from the Report Designer. However, there are default behaviors and options specific to the Microsoft™ Excel™ output.
The XLS format is limited to 65,536 rows per sheet. If the number of rows exceeds this, an additional sheet is automatically created.
The XLSX format can only be opened with newer versions of Microsoft Excel (2007 or later). A backward compatibility pack can be downloaded from Microsoft; however, the XLSX format is then subject to the 65,536 limit of the earlier versions.
Any existing report, including ASCII, can be output to an Excel spreadsheet.
The report application generates values to be placed in the Excel report; it does not generate Excel formulas. You can edit your Excel spreadsheet to take advantage of Excel's computational abilities.
Default behavior
When a report is output to an Excel spreadsheet, there is a tradeoff between WYSIWYG capability and computability. The default behavior of items in Excel output places emphasis on computing the values in the cells, rather than on maintaining a WYSIWYG appearance.
When items in the report design intersect each other, the items are rendered as images and the resulting bitmap is inserted into the Excel spreadsheet. If debugging is enabled, a warning is issued.
- Whitespace (empty columns, empty rows) is eliminated when possible.
- Elements that overlap are placed in the same column or row but maintain their relative placement (above/below or right/left). Elements that overlap horizontally are placed in the same column, and elements that overlap vertically are placed in the same row.
- Non-overlapping elements are placed in separate cells.
- Graphical elements such as bar codes are rendered as images.
- Business graphs are rendered as tables.
- For pivot tables, only the fact rows are shipped. The pivot table is rendered as a flat table structure without being disrupted by group totals. You can then use the data to create an Excel pivot table with business charts and row-spanning formulas.
Changing default behavior
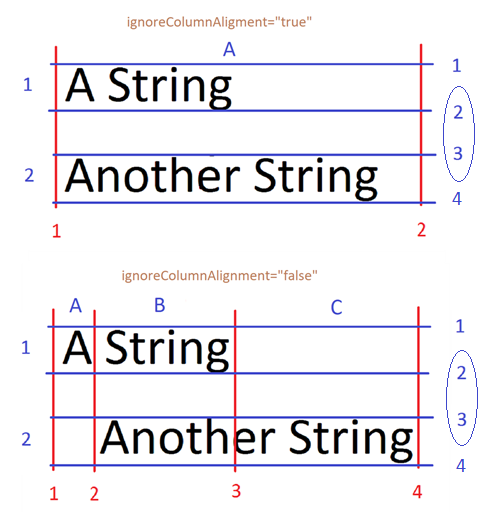
Figure: ignoreColumnAlignment in Excel sheets

If ignoreColumnAlignment is TRUE, the two overlapping elements produce only one column. If ignoreColumnAlignment is FALSE, the two elements produce at least three columns. In both cases, removeWhitespace is TRUE (the default), which means there are only two rows. If removeWhitespace was set to FALSE, the whitespace would create an extra row between "A String" and "Another String".