Backtrace view
In the Backtrace view you can view or trace the functions called while running the program.
Figure: Backtrace view
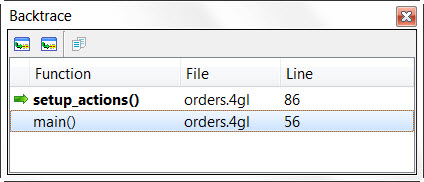
The first line displayed is the current line. Then the calling function is displayed, and so on, up to the main function. The Backtrace view is display-only. Lines are added in the output while the program is running.
An arrow points to the currently executing function.
The integrated Toolbar includes options to navigate a backtrace.
- Go to selected frame
- Make the selected frame the current frame. The Data view will be updated with the variables available in the selected frame.
- Go to source code
- Display the source code corresponding to the selected frame.