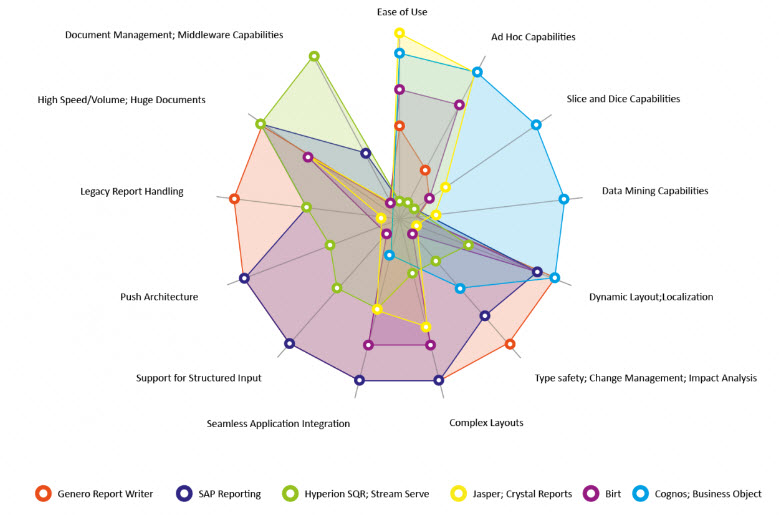
spider web chart
A type of chart that plots multiple quantitative variables in a radial grid pattern. Each
variable is given an axis that starts from a central point. Each axis is arranged radially around
that point, with equal distance between them.