The Category Chart layout object allows you to create a graph that has two keys for each set of values.
Draw As property: This kind of graph can be drawn as a Bar, Bar3D, Stacked Bar, Line, Line3D, Area, Stacked Area, Waterfall, or as a table.
In a waterfall graph, the value in the last category of the data set should be (redundantly) specified as the sum of the items in the preceding categories - otherwise, the final bar in the chart will be incorrectly plotted. At the present time, the waterfall graph can only have one category.
This Bar chart presents total revenue (the value) by the Customer Name and Product Category (the keys):
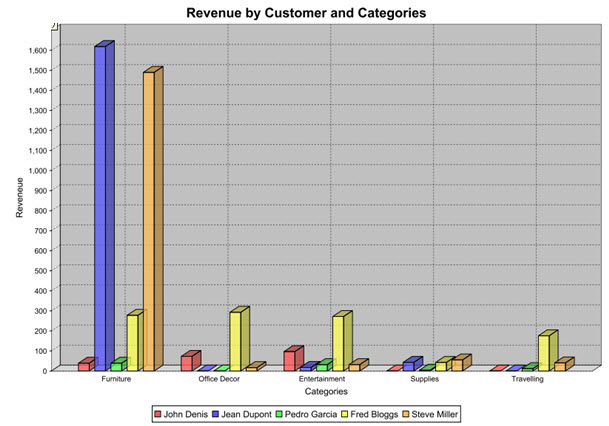
Figure 1. 3-D Bar Chart example: Revenue by Customer and Categories
The Category Chart Item layout object specifies the key data items and the values data item in its properties:
- Category Key - the categories for the data (the type of product purchased in the example chart); must be a String.
- Key - the data in each category is grouped by this property (the customer name); must be a String.
- Value - the chart will display the total of this property (the unitprice of order line items) for each category (product) divided into groups by Key (customer name); must be Numeric.
- Name - name of this report item in the Structure view; must be a String.