Custom keys

You can enter any valid expression for the String value of a key property.

This could be a substring or a concatenation of existing Strings. For example, this expression would group the data values based on the first letter of shiplastname:
orderline.orders.shiplastname.substring(0,1)

Examples

This chart uses the last name as the key (trimmed of trailing blanks), as shown in the Properties view. The unit price on each order for each unique last name is rolled up to a total as shown on the chart. There are five unique names:
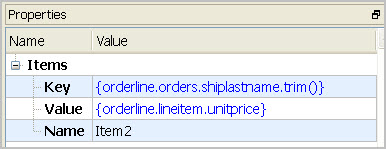

This figure is a screenshot of properties set for Map Chart Items. The Items Key is set to {orderline.orders.shiplastname.trim()}. The Value is set to {orderline.lineitem.unitprice}, and the Name is set to Item 2.

Figure 1. Properties panel for the chart Items (where key uses trimmed last name)
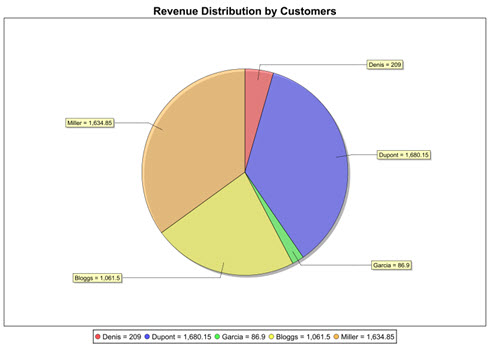

This figure is a screenshot of pie chart showing Revenue Distribution by Customers. Each slice of the pie chart has an associated label displaying the name used for grouping, as well as the total revenue number for that slice. The chart title displays at the top, the chart legend displays at the bottom.

Figure 2. Chart showing Revenue Distribution by Customers (where key uses trimmed last name)

And this chart uses the first letter of the last name as the key, as shown in the Properties View. The unit price on each order for each unique first letter is rolled up to a total as shown on the chart. In this chart, there are only four unique first letters, as two customers have last names beginning with D:
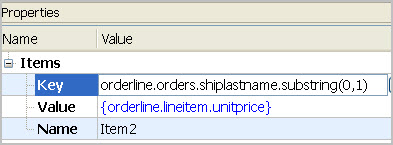

Screenshot of properties set for Items. Key set to {orderline.orders.shiplastname.substring(0,1)}, Value set to {orderline.lineitem.unitprice}, Name set to Item 2.

Figure 3. Properties panel for the chart Items (where key uses substring)
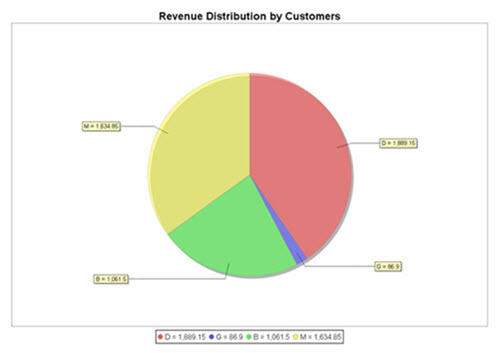

This figure is a screenshot of a pie chart showing Revenue Distribution by Customers. Each slice of the pie chart has an associated label displaying the substring used for grouping, as well as the total revenue number for that slice. The chart title displays at the top, the chart legend displays at the bottom.

Figure 4. Revenue Distribution by Customers (where key uses substring)