To examine an area of code more closely, set a breakpoint at the desired line or function. A right-click on a line of code allows you to set, disable, and delete breakpoints.
- Add/Delete breakpoint
- Sets / removes a breakpoint fro the current line. Clicking in the gutter will also set / remove a breakpoint at the corresponding code line.
- Enable/Disable breakpoint
- If checked, the current breakpoint is active; otherwise it is disabled, but still exists and can be reactivated later. Enabled breakpoints are marked by a red dot; the dot has an empty center if the breakpoint is disabled.
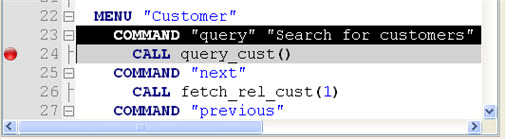
Figure 1. Set Breakpoint
About breakpoints
When the program is run, execution will stop at this line, waiting for your action. A breakpoint icon is shown in the gutter.Breakpoints are processed as private to each user. They are linked to a source code line, not to a line number; therefore, altering a source file will not affect the breakpoint's relative position in functions.
Breakpoints are stored when the Debugger is stopped, and set when the Debugger is started. Previously set breakpoints will be available each time the Debugger is run.
Initial breakpoint
Set initial breakpoints prior to launching the Debugger. Otherwise, the application executes normally within the Debugger framework and you must use the Debugger Interrupt option to suspend it to monitor Debug views or employ Debugger functions. Setting a breakpoint at the first function call is usually a good starting point.
Additional breakpoints
After the initial Breakpoint is set, you can either set additional breakpoints prior to starting the Debug session or start the session with the single breakpoint. Breakpoints on Function entry points automatically open the function source module during the debug session so you can examine the code more closely and even follow program execution line-by-line in the function if needed. You may find it helpful to set function breakpoints before starting the session, but you can also set additional breakpoints as you use Debugger commands to navigate during the session.