This element allows you to create a graph that maps a series that has two values, as an XY-plot. it is used most often for scientific data.
Draw As property: This type of graph can be drawn as a Polar, Scatter, Area, Stacked Area, Line, Step, Step Area, Table, Sorted Table, or Time Series (property.) This graph presents the x and y values of three series of trigonometric functions.
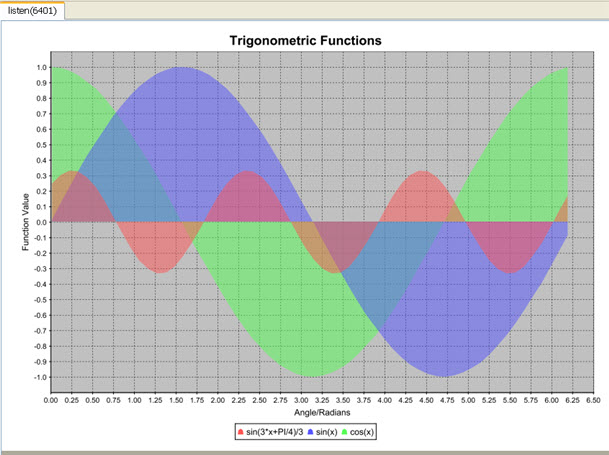
Figure 1. XY Chart example
The XY Chart Item element specifies the value data items in its properties:
- Series Title - the caption for the series of values being charted; there can be more than one series (three in Figure 1); must be a String.
- X - the values for the x axis; must be Numeric.
- Y - the values for the y axis; must be Numeric.
- Name - name of this report item in the Structure view; must be a String.