Create a pivot table
Create a pivot table in a report, add dimensions and measures, and set additional properties as needed.
- Open a new or existing report in Report Designer.
- If you are creating a new report, specify the data schema to be used for the report.
-
From the Tool Box view, drag and drop a Pivot Table to the report structure under the Page
Root.
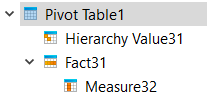
A Hierarchy Value (representing a dimension) and Fact are added as children of the Pivot Table, with a Measure as a child of the Fact, as in Figure 1.
Figure: New Pivot Table Report Structure 
- If required, add additional dimensions by dragging the Pivot Table Hierarchy Value object from the Tool Box and dropping it into the Pivot Table.
-
Select each Hierarchy Value and edit its
properties:
- Value - Column name for the dimension.
- Numeric Column- If this check box is selected, the dimension is Numeric. If this check box is not selected, the dimension is a String.
- Aggregation types, such as Compute Totals, Compute Count, and Compute Average.
- Title - Title for the dimension.
- If required, add additional Facts and Measures by dragging the objects from the Tool Box and dropping them into the Report Structure. Measures are used to aggregate numeric values and must be placed under Facts.
-
Select each Measure and edit its properties:
- Value - Column name for the measure.
- Numeric Column- If this check box is selected, the measure is Numeric. If this check box is not selected, the measure is a String.
- Title - Title for the measure.
- Format - The output format of the measure. Only required if the dimension is Numeric.
-
Set additional properties for the Pivot Table as required:
- Title - Title for the pivot table.
- Draw As: By default, the Pivot Table is drawn as a Table. Edit DrawAs to use another style, such as a Bar or Pie chart.
- Compute aggregates on the innermost dimension - Whether values are aggregated for the innermost dimension (the dimension that contains the facts or values).
- Hierarchies input order - The order by which the data is presorted. Uses the Order specifier data type.
- Display selection - Which of the declared dimensions or measures to display. Uses the Column selector data type.
- Display recurring dimensions - Whether recurring dimension values in the same column of table output should be displayed.
- Range Lower Bound and Range Upper Bound - The lowest and highest values on the Y-axis. Only applies if the Draw As type has a Y-axis.
-
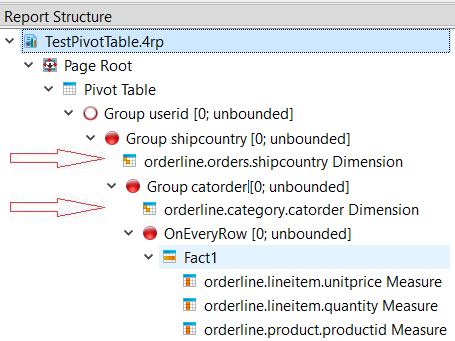
In the Structure View, arrange the dimensions and measures so that the values are triggered at
the desired point in the data stream. See Figure 2 for an example.
Figure: Pivot Table Dimensions in the Structure View 
For further details, see Organizing pivot table elements in the Structure view.
- Save the report.
Note:
To create a dynamic pivot table, first define the static pivot table and then use the Pivot library APIs to dynamically configure it at runtime based on user-supplied information. An example can be found in the DynamicPivotTable report in the OrderReport demo (see Sample pivot table reports).