The work area
The work area in the Main Window provides a GUI interface to the report.
You design a report by initially dragging and dropping containers (such as such as Mini Pages and Layout Nodes) from the Tool Box view into the work area, stacking and arranging them to create the report page. Next, report elements such as Word Boxes, Decimal Format Boxes, and Image Boxes are dragged and dropped into the containers.
From the Data View, if you have specified the data schema, you can drag and drop data values into a container.
Page headers and footers can also be defined.
When you select a report element in the work area, its properties are listed in the Properties view. In the Properties view, you can change a property value. For example, a Word Box has a Text property where you can enter text to be displayed in the report.
If you select multiple elements, all items in the current selection are affected by the current operation, such as moving, sizing, or changing the type or text.
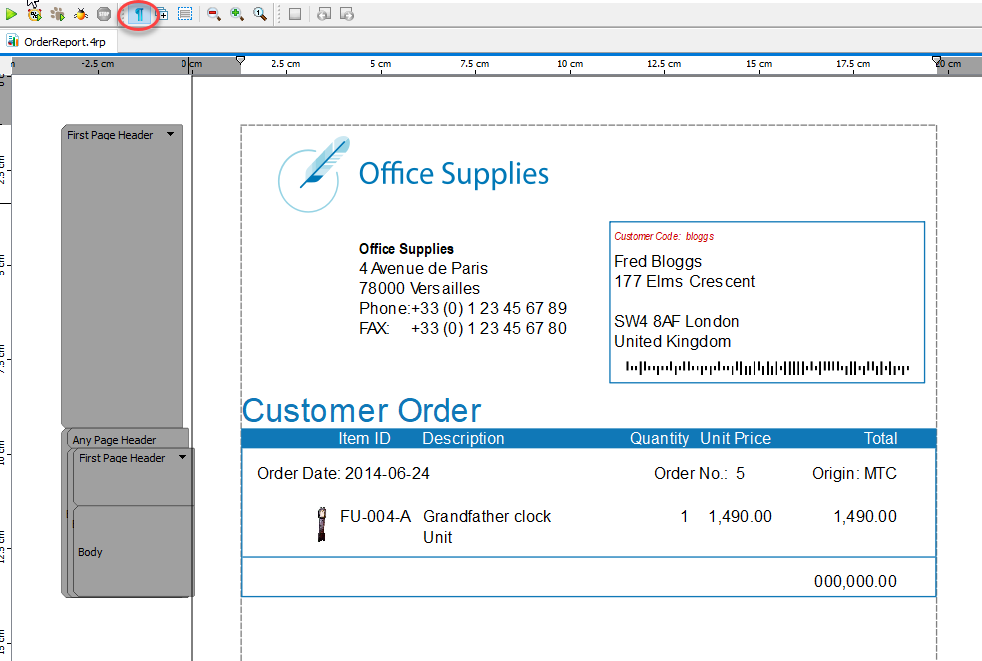
Preview mode
Use the menu or the Toggle View icon (which resembles a paragraph mark) to toggle the work area between the report design and a preview of the report. When you preview a report, sample data is displayed on the page. For example, Figure 3 shows the OrderReport.4rp report in preview mode (note that the Toggle View icon is selected in the Toolbar).
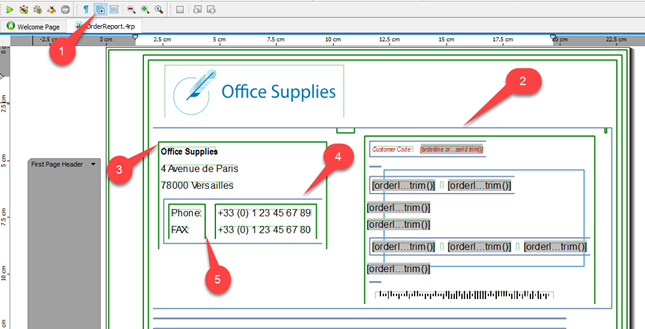
Expanded mode
Use the menu or the Expand Document icon to toggle between normal and expanded mode. Expanded mode displays all containers and indicates the layout direction. A grey box indicates a horizontal direction, while a green box indicates a vertical direction. An open side of the box indicates that the container is filled in that direction.
Figure 3 shows the OrderReport.4rp report in expanded mode. This shows, for example:
- The Expand Document icon is selected in the Toolbar.
- The Customer Details Mini Page is in a grey container open at the left; it is filled horizontally from right to left (Layout Direction=rightToLeft).
- The Office Address Layout Node is in a green box open at the bottom; it is filled vertically from the top down (Layout Direction=topToBottom).
- The Phone Details Layout Node is in a grey box open at the right; it is filled horizontally from left to right (Layout Direction=leftToRight).
- The Phone Titles and Phone Numbers Layout Nodes are in green boxes open at the bottom. They are filled vertically from the top down (Layout Direction=topToBottom).
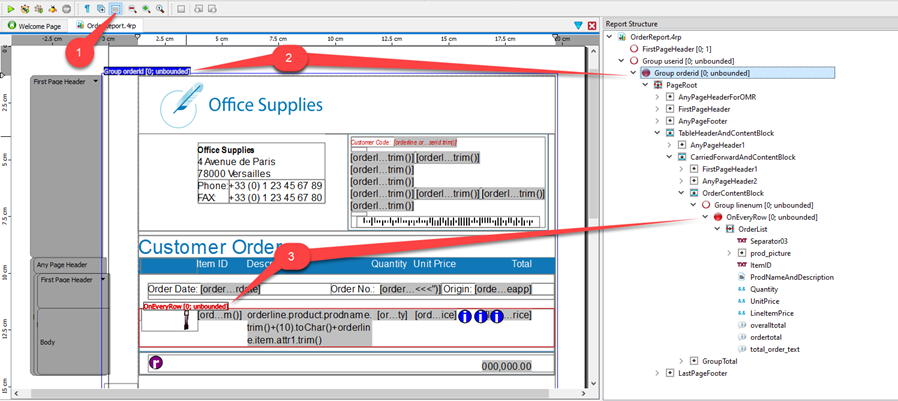
Highlight repeating regions
Use the menu or the Highlight Repeating Regions icon to show or hide the groups of elements that are repeated in the report. By default, the repeating groups are shown. The repeating regions on the report work space correspond to triggers in the Structure view.
Figure 4 shows the OrderReport.4rp report with repeated regions highlighted. This shows:
- The Highlight Repeating Regions icon is selected in the Toolbar.
- The Group orderid contains the PageRoot and its children; that is, the PageRoot is repeated when the orderid changes.
- The OnEveryRow group contains the OrderList and its children; that is, the OrderList is repeated on every row of the list.