Organizing pivot table elements in the Structure view
The pivot table elements (pivot table, hierarchy/dimension, fact, and measure) must be organized within the Report Structure view so that values are triggered at the desired point in the data stream. There are varying methods for organizing your pivot table elements, but some methods are more efficient than others.
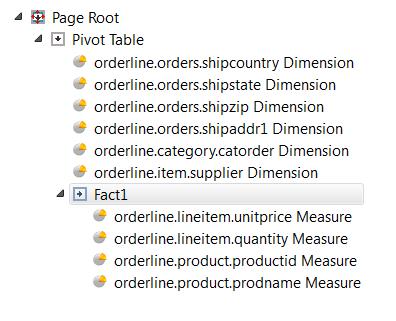
For example, Figure 1 shows a table with six dimensions (HIERARCHY elements) and four measures (MEASURE elements), without any reorganization or triggers.
Defining columns
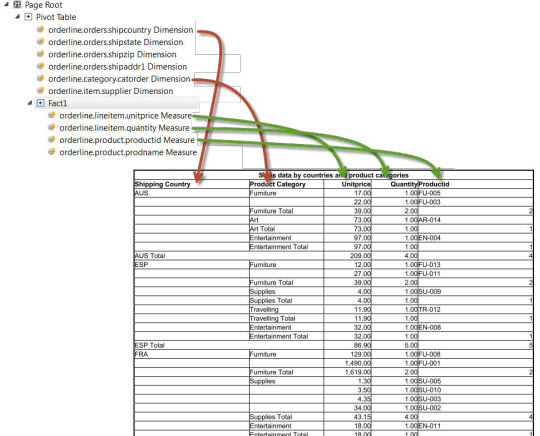
- Dimensions and measures define the columns of the table.
- Not all defined dimensions and measures were selected for display.
- The title of the table and the selection of the dimensions is defined in the pivot table element
- The title of the columns are defined in the dimension and measure elements.
- The selection of the measures is defined in the fact element.
Defining rows
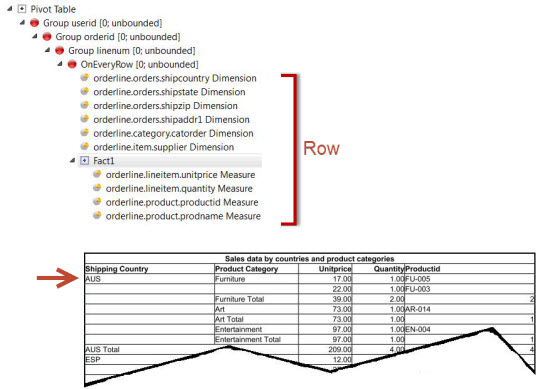
A row of a table is formed by the entity of dimension declaration followed by one fact element. Typically one row is defined for the table, and is placed in a trigger to be repeated for each input record, as in Figure 3.
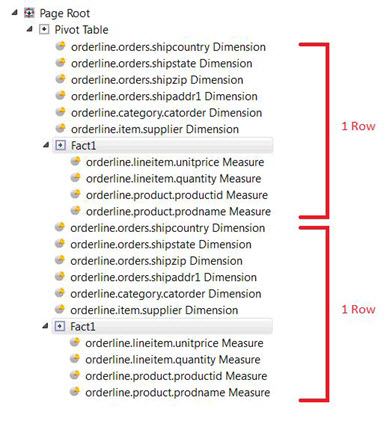
You can specify the rows literally, but it is inefficient and highly unusual. In this case, all rows must have exactly the same structure (number of dimensions and measures, types, and so on), as in Figure 4.
Arranging hierarchies
You can organize the pivot table hierarchies (dimensions) to optimize the output and minimize the volume of the data stream.
For best efficiency, the hierarchies should be shipped sparsely, that is, not all hierarchy values need to be shipped for every row. Compare the hierarchy values of two consecutive rows from right to left starting with the innermost dimension, and omit any value if it is the same in both rows, until you reach the first dissimilar column.
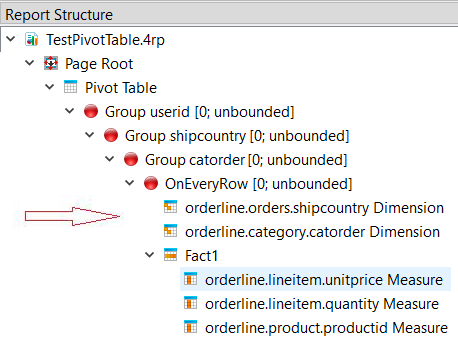
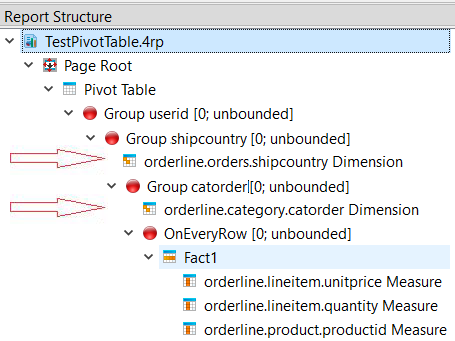
For example, see the report structures in Figure 5 and Figure 6, where the arrows indicate the location of the hierarchies. Figure 5 uses a flat representation. Figure 6 places the hierarchies in the corresponding trigger, so the value for "shipcountry" is only shipped only on changes of "shipcountry"; the value remains the same for all orders shipped to that country. If you run the report, the output looks similar in both cases, but the data stream for Figure 6 requires less processing and is therefore more efficient.
