Absolute or relative positioning
The position of a report element can be absolute, to enable reports that use pre-printed forms, or relative, adjusting as needed based on the length of the report element as well as its parents and siblings.
- Relative positioning (dynamic layout)
- If you CTRL+drag the report element onto the report page (work area), the element is positioned
relative to the existing elements. Because the design changes dynamically based on the actual size
of the report elements, this is the recommended method for most cases. When you drag the element, a
moving red line indicates where the element will be located when you drop it. A green dot on the
element indicates its attachment point.
If you select a container and then double-click an element in the Tool Box view or Data View, the element is automatically positioned after the last existing child object in the container.
Relative positioning offers the following advantages:
- The reports adapts to changes of font face, style, and size.
- The report can be localized.
- The paper's size, margins, and orientation can be easily changed.
- The report is easier to edit and maintain.
- Absolute positioning (static layout)
- If you drag and drop report elements on the report page (work area) using the mouse, you can position the element at a specific spot on the virtual grid of a container. This is recommended when you need to match the report design to a pre-printed form. When you drop the element, it snaps to the closest point on the grid. A red dot on the element indicates its attachment point.
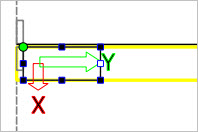
As you drag an element, a moving thin black line helps you line it up with other elements on the report if desired. The X and Y properties of the element in the Properties view indicate its location relative to its parent. These are automatically calculated when you drop an element into a container, or move it around. When you move it inside a container, the lines of the container are highlighted in yellow :
Figure: Highlighted container
All elements that are dragged from the Tool Box view or Data View have the floatingBehavior property set to "enclosed", meaning the object will be enclosed in its parent.
- X-Axis and Y-Axis arrows - These indicate the direction of the X-Axis and Y-Axis. On containers, the Y-Axis arrow indicates the filling or layoutDirection of the container. For example, a Stripe lays out its children next to each other left-to-right within the container, and the Y-Axis arrow points to the left. Other containers have the Y-Axis arrow pointing down, as they lay out their children next to each other in a top-to-bottom direction.
- Attachment point - The attachment point at an intersection of the X-Axis and Y-Axis is indicated by a green dot (for relative positioning) or a red dot (for absolute positioning.) If you drag the edge of the element to expand its size, the attachment point remains fixed. You can move the attachment point using the right-click context menu.
Elements on a report have a contextual (right-click) menu of options that allow you to:
- Align elements within a vertical or horizontal container, and move the attachment point on the element.
- Change the width and height of elements.
- Change the focus to a different container or other element.
- Change the object type.