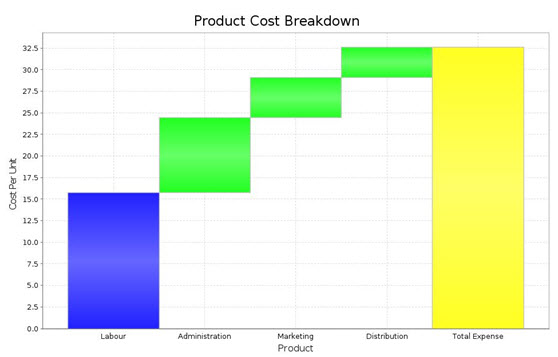
waterfall chart
A type of chart that plots how an initial value is increased or decreased by a series of
intermediate values, leading to a final value. The initial and final values are displayed as entire
columns, while the intermediate values are displayed as floating columns.