A static pivot table uses predefined dimensions and measures when creating the report.
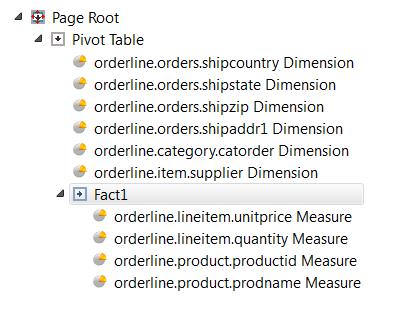
A pivot table is constructed from four elements.
- The PIVOTTABLE element represents the table itself and all other elements are contained in it.
- The columns of the table are described by HIERARCHY elements (in case of a dimension column) or MEASURE elements (in case of a value column).
- MEASURE element are grouped in FACT elements.

Figure 1. Pivot table elements in the Structure View
This image shows a table with six dimensions (HIERARCHY elements) and four measures (MEASURE elements).
Column definition
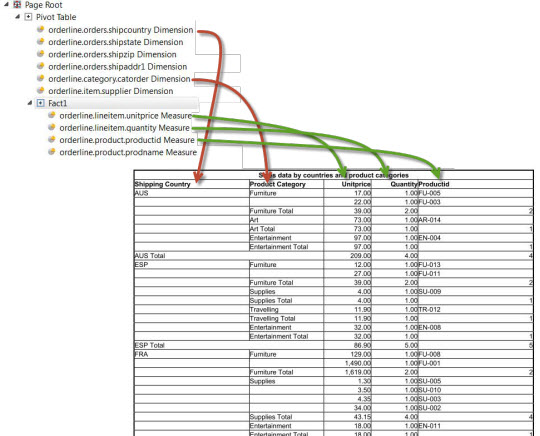
This figure shows a pivot table definition on the left and a possible rendering of the table on
the right.
- Dimensions and measures define the columns of the table.
- Not all defined dimensions and measures were selected for display.
- The title of the table and the selection of the dimensions is defined in the pivot table element
- The title of the columns are defined in the dimension and measure elements.
- The selection of the measures is defined in the fact element.

Figure 2. Report columns
Row definition
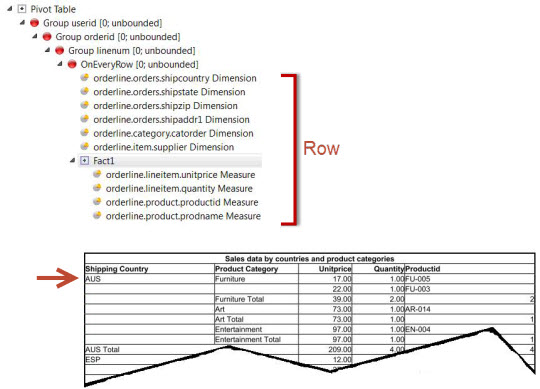
The entity of dimension declaration followed by one fact element forms a row of a table. Typically one row is defined. It is placed in a trigger to get repeated for each input record.

Figure 3. Report row placed in a single trigger
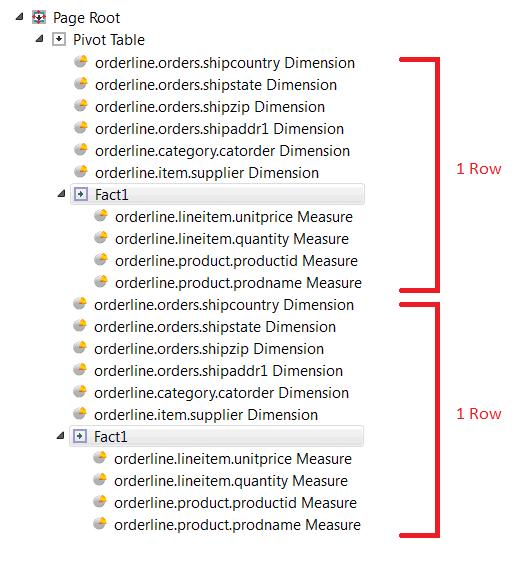
It is allowed, but highly unusual, to specify the rows literally. All rows have to have exactly the same structure (number of dimensions and measures, types, and so on).

Figure 4. title