The MapChart layout object allows you to create a graph that has one set for values to be mapped, grouped together by a specific key.
Draw As property: This kind of graph can be drawn as a Pie, Pie3D, Bar, Bar3D or Ring, Table, Sorted Table, Aggregated Table. For example, the pie chart in Figure 1 presents the total revenue (the value) for each customer (the key), based on the OrderReport.rdd file in the Report Writer sample programs.
Draw Legend and Draw Labels property: These properties have been added to customize the appearance of the plots. In particular the option to remove the legend is useful when more then several charts are drawn next to each other in a document; the option can be used to make the charts share a single legend by specifying the legend only on one of the charts.
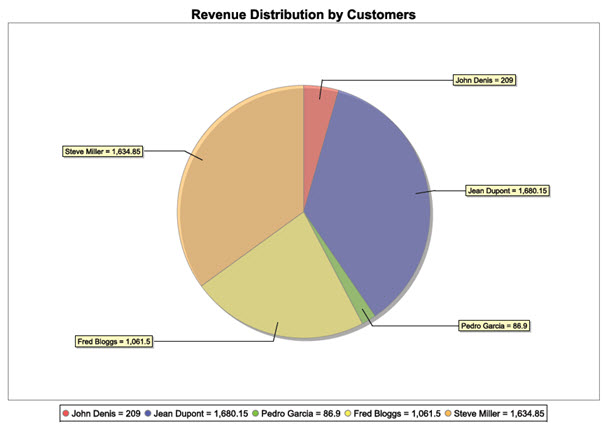
Figure 1. Pie Chart example
The Map Chart Item layout object specifies the key data item and the values data item in its properties:
- Key - the data is to be grouped by this property (customer name in the example chart); must be a String.
- Value - the chart will display the total of this property (total unitprice in the example chart) for each key (customer name); must be Numeric.
- Name - name of this report item in the Structure view; must be a String.
- Color - gives each slice a specific color. When a color is specified for a particular key in one chart, then the same color will be used for that key in other charts too, unless specified otherwise. If different colors are specified for the same key, the most recent value is used. If the same color is specified for a number of different keys, only one of these keys will be painted with the specified value; the other slices will be painted with interpolated values. Charts may use gradients, shading, or translucency with the colors specified.