Webview in the Debug panel
You can configure the GDC to launch the web debugger as soon as a webview is started.
The web debugger provides access to the developer tools that allow you to examine and debug the code behind a UR application or a web component.
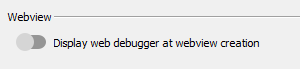
From the Debug panel, use the toggle to set whether the web debugger launches when a webview is started.
The Debug panel is only available in debug mode (gdc
-D).
When enabled, it applies to all webviews used in the GDC, such as Universal Rendering and the SSO/Prompt dialog.
When the Genero Desktop Client is in Universal Rendering mode, all applications are in a webview when presented by the GDC. As a result, when the webview toggle is enabled, applications presented in the GDC open with the web debugger. For information on when the GDC uses Universal Rendering versus native rendering, see Genero compatibility for the GDC.
Regardless of this toggle switch, when the GDC is in debug mode, the end user can open the web debugger with the Alt-Shift +right-click shortcut.