Console in the Debug panel
The Debug Console displays color-coded information about sessions.
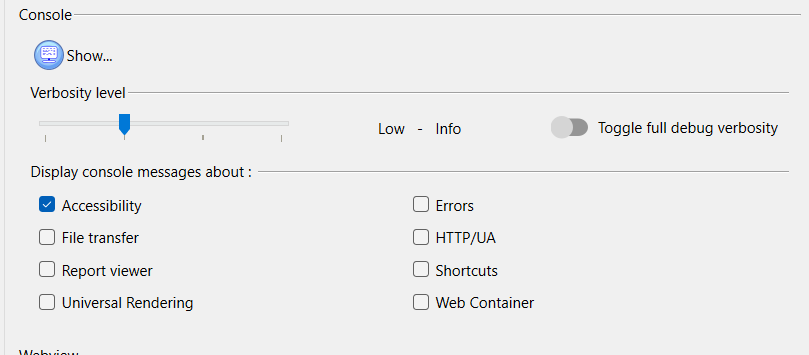
Configuring the Debug Console
The Debug panel is only available in debug mode (gdc
-D).
- Use the checkboxes to select the type of messages to display, for example, whether Errors or File transfer messages are displayed.
- Use the sliding bar to set the verbosity level. The Toggle full debug
verbosity switch alternates between the least verbose and most verbose settings. The
labels separated by a dash provide the log level settings of the GBC in Universal Rendering mode.
The Highest and High console log levels set the GBC in
Debug log levels, and the Lowest and
Low console log levels set the GBC in Info log level.
Important:
The slider affects the verbosity of the GBC in the webview debugger.
Viewing the Debug Console
When you have configured the Debug Console, click the Show button to open it.
The Debug Console is only available in Debug mode.
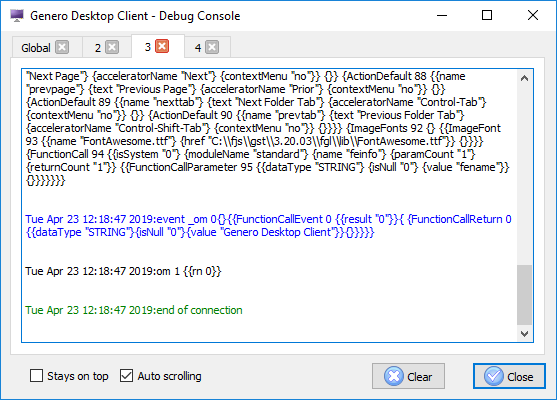
- Blue: What is sent by the GDC to the runtime system.
- Black: What is received by GDC from the runtime system.
- Green: Comments or other information.
- Red: Error messages.
The Debug Console can help you to see the communication between the GDC and the runtime system. The first tab (Global) contains all communication threads. The communication threads are also reported individually, one tab for each application.
Select Stays on top to have the Debug Console stay in foreground and always be visible.
If Auto scrolling is selected, the log is forced to auto scroll to the end each time new content is received. When you open the Debug Console, Auto scrolling is selected by default.
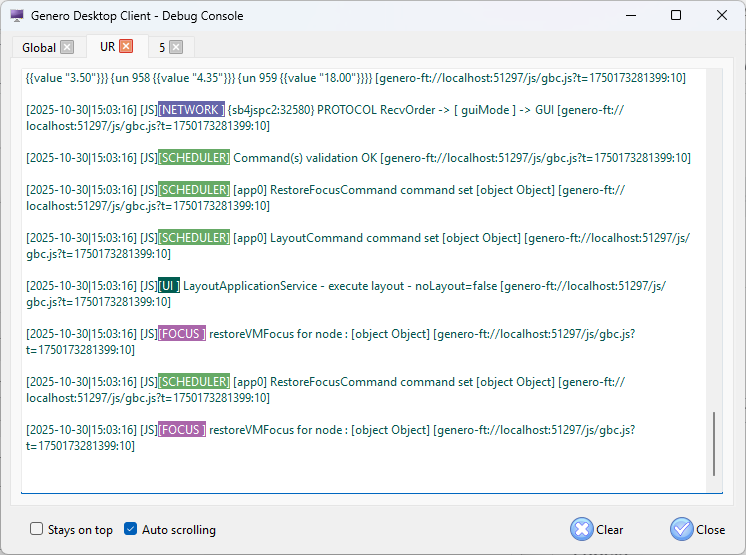
If an application with a WebComponent uses Native Rendering, the JavaScript console log is written to the GDC log and therefore is written to the corresponding application tab (1, 2, and so on).
Searching in the Debug Console
- CTRL+F to search.
- F3 to go to the next result.
- SHIFT-F3 to go to the previous result.
When you use the search, auto scrolling is automatically disabled.