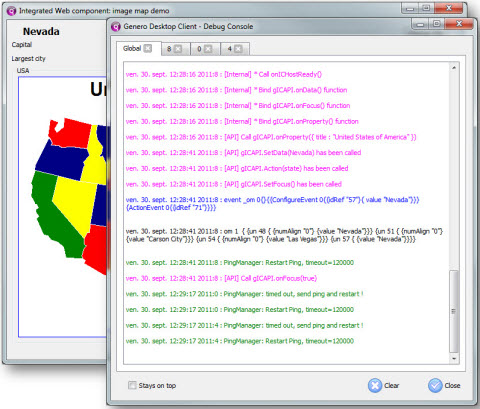
Web Component: Debugging information
This topic introduces the debugging information added to assist with debugging the WebComponent.
Introduced in 2.30, WebComponent is a powerful mechanism that allows you to integrate any "web based" component in your 4GL application. Because of the fully integrated aspect, it was sometimes difficult to setup web components within GDC, and to understand what could go wrong (for example: JavaScript™ error). GDC 2.40 is now showing new debugging information in the debug console:
- JavaScript Messages
- WebComponent internal debugging info: url loaded, http errors
- gICAPI object debugging info: creation, bridge (GDC // JavaScript) setup
- API debugging: calls to onData, onProperty, onFocus, setData, setFocus, Action
Figure: Debug console

You will have to enable webcomponent debugging in the console to see the messages.