Viewing the Debug Console
The debug console displays color-coded information about your session.
Figure: Console configuration in the Debug panel
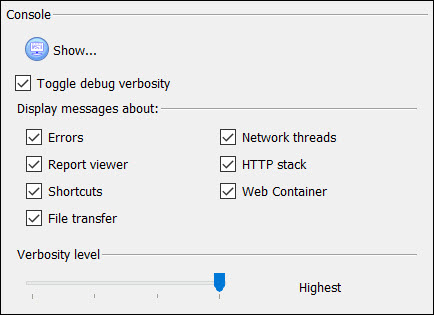
The Console section of the Debug Panel defines the verbosity of the messages to appear in the Debug Console. Select the type of messages to display, and use the sliding bar to set the verbosity level.
The Toggle debug verbosity check box alternates between the least verbose and most verbose settings.
Click on the Show... button and the Debug Console window opens.
Figure: Debug Console
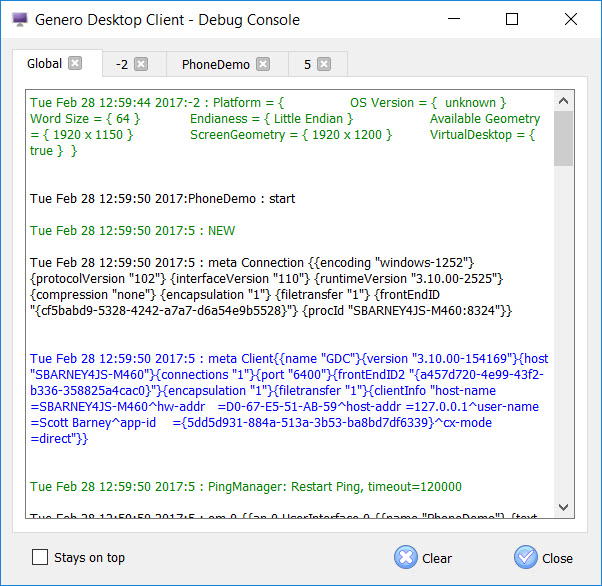
- Blue: What is sent by the GDC to the Runtime System.
- Black: What is received by GDC from the Runtime System.
- Green: Comments or other information.
- Red: Error messages.
This debug console could help you to see the communication between the GDC and the Runtime System. The first folder contains all communication threads. The communication threads are also reported individually in the additional tabs, one for each application.
If you want the Debug Console to stay in foreground and have it always visible, check Stays On top.