The debug console displays color-coded information about your session.
If you click on the Console button, a Window called Debug Console will appear.
Important: The debug console is only available in debug mode.
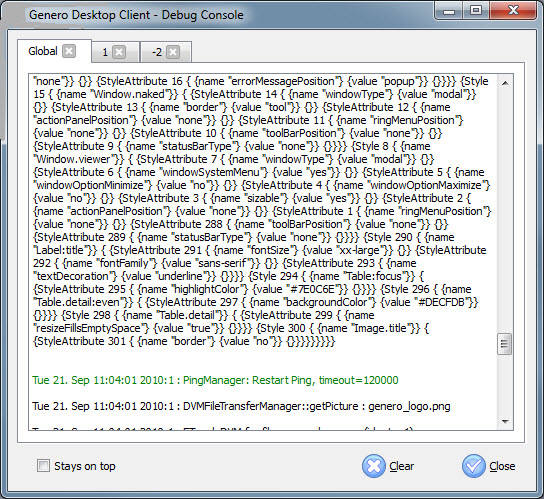
Figure 1. Debug console
In this window some debug information will be displayed. The information
is categorized by color:
- in blue - what is sent by GDC to the Runtime System
- in black - what is received by GDC from the Runtime System
- in green - some comments or other information
- in red - error messages
This debug console could help you to see the communication between the GDC and the Runtime System. The first folder contains all communication threads which are also reported separately in the other folder tabs (one for each application).
If you want the debug console to stay in foreground and have it always visible, check the Stays On top check box.