View the AUI debug tree
Inspecting the application user interface (AUI) tree helps you to debug and test your Genero Browser Client (GBC) application.
Before you begin
Run the GAS by executing the following command:
$ httpdispatch -E res.uaproxy.param=--developmentThis forces the GBC into debug mode.
Running an application in debug mode may effect the behavior of the GBC in the browser. For
example, the prompt that is usually displayed when the user presses the browser's back button
(Are you sure you want to leave this page?) is no longer displayed.
- The AUI Tree tab shows the AUI debug tree for the current application.
- The Proxy logs tab shows the status of proxies, responses sent, and system error messages. See Log files in the Genero Application Server User Guide.
- The VM logs tab shows the log for the Dynamic Virtual Machine (DVM) started by the application.
- When running in a browser, the Run in GDC (play button) is displayed on the far right of the top bar. By clicking on this icon, you download a shortcut allowing you to open the current application with the GDC.
- GBC version
- Build number
- GAS version
- FGL version
Steps to view the AUI tree
-
Click on the [Debug] AUI tree icon in the
chromebar.
Tip:
You can also activate the AUI debug tree by pressing Ctrl (or Command on macOS) and right-clicking the mouse.
The GBC Debug tools page opens in a new browser tab. You see the AUI debug tree of the current application you have open in the GBC browser tab.
Figure: Debug AUI tree 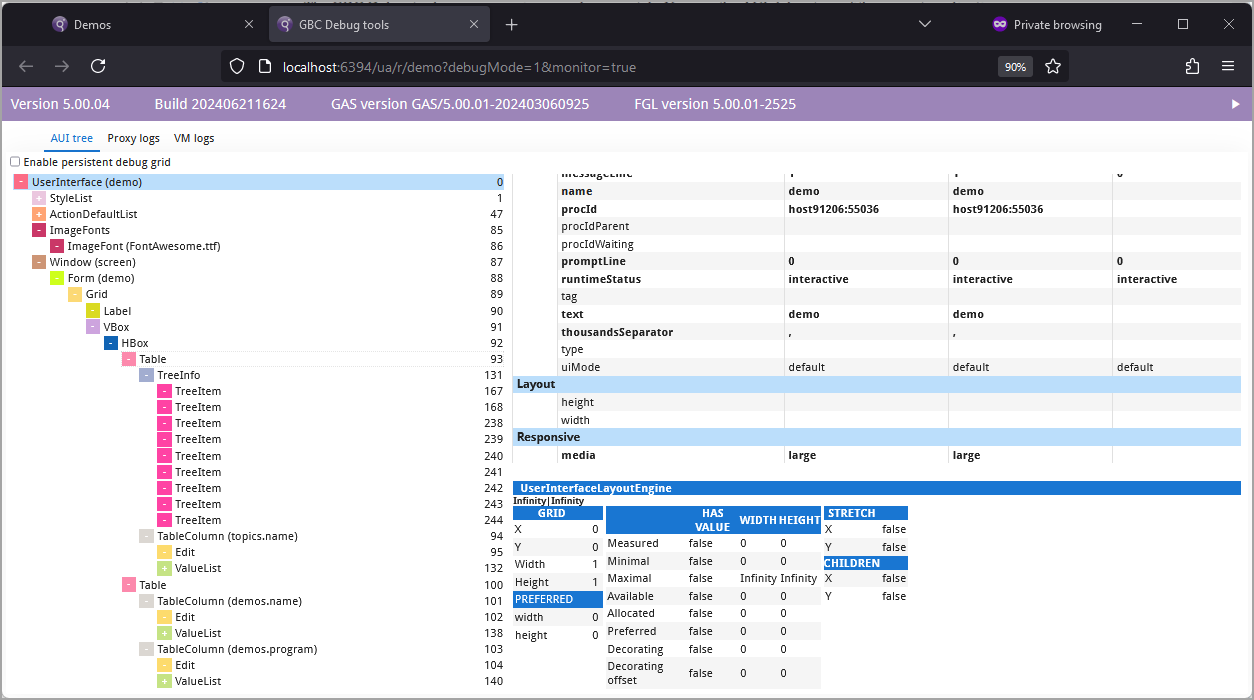
The GBC Debug tools page updates automatically as you navigate your application in the application tab.