Application page
The application interface consists of a main container, a sidebar, a window list, and a chromebar.
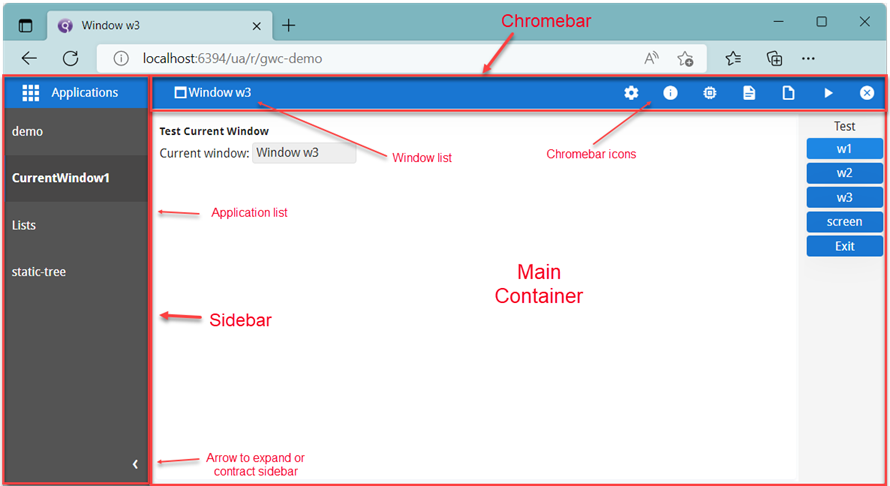
Main container
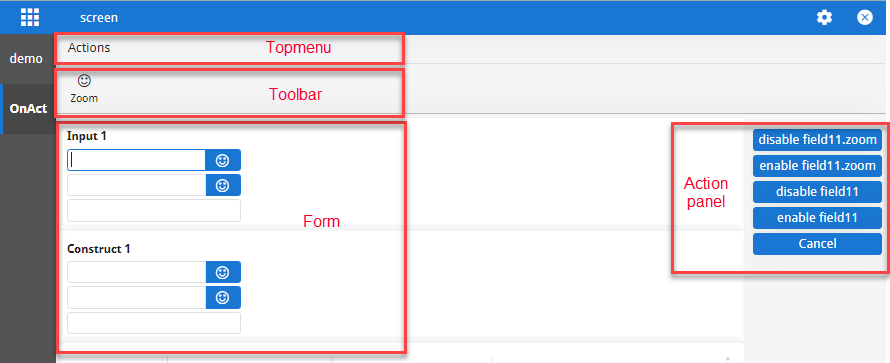
The main container displays the application. It may contain topmenus, toolbars, forms, and action panels.
Sidebar
The sidebar lists all applications that are open and active. For example, if an
application is launched using a "RUN
command WITHOUT WAITING" instruction, both the calling and called applications
are simultaneously active, and both appear in the sidebar.
If only one application is active, the sidebar does not display.
Switch between active applications by selecting from the application list. The selected application displays in the main container. When you close an application, it is removed from the application list.
You can use the arrow at the bottom of the sidebar to expand it to its maximum width, or contract it to its default width.
On mobile devices, the sidebar is not visible by default. It can be accessed from the icon located next to the window name in the title bar.
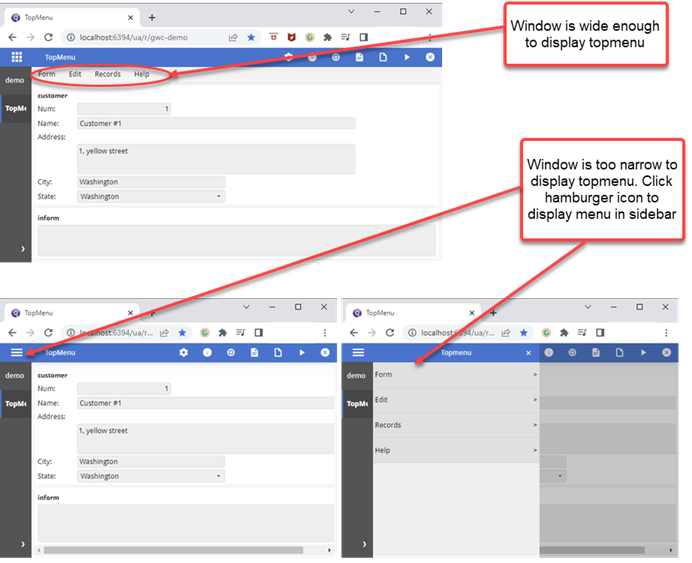
Topmenu
If an application has a topmenu, the screen size determines whether it can be displayed along with the application in the main container. If the screen size is too small to display the topmenu, the topmenu becomes part of the sidebar, and you access the topmenu using the hamburger icon.
Window list
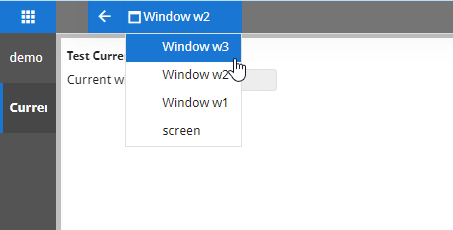
The window list is a drop-down menu containing all open windows. Switch between windows by clicking on the window list and selecting from the menu. The selected window displays in the main container.
If the selected window is inactive, the window list displays an arrow. Click on this arrow to return to the active window.
If only one window is open, the window list menu is not active.
- An "OPEN WINDOW" instruction.
- A "RUN command" instruction that launches an application with an OPEN WINDOW instruction, but that does not specify the "WITHOUT WAITING" clause.
For further information about the RUN and OPEN WINDOW commands, see RUN and OPEN WINDOW in the Genero Business Development Language User Guide.
Chromebar
The chromebar displays icons for selecting windows, changing settings, viewing status, debugging the application, and closing the application.
The icons you see on the chromebar will depend on your current mode and customization. By default:
- In normal mode, the chromebar displays the Settings and Close icons.
- If a file is being uploaded, the chromebar also displays the Upload status icon.
- If the GBC is waiting for a response from the server, a progress bar displays above the chromebar, indicating the Runtime status.
- In debug mode, the chromebar also displays the About, [Debug] AUI Tree, Proxy logs, VM logs, and Run in GDC icons. For more information, see Debugging.
You can modify these defaults by customizing the chromebar.
Hovering your mouse over the icons shows text that describe their function.
- Settings
- Opens the GBC Settings dialog, which allows you to specify:
- Interface language - The language for GBC messages. This setting is independent from (and does not affect) the localization of the application.
- Interface theme - The theme for the application. Changing the theme immediately changes the look-and-feel of the application.
- Stored Settings - Settings regarding the user interface and user modifications, such as table formatting (column sizes, sorting, column display, frozen columns, and so on), splitter positions, and sidebar visibility and size. Select the Enable Stored Settings checkbox to allow stored settings, or deselect to force the application preferences.
- Debug & QA (Only available in debug mode)
- The Typeahead duration is used to simulate a slow network and force the typeahead mechanism to be triggered. The default is 5ms, meaning the layout request would be delayed for 5ms. It could be less, but the difference might not be visible or relevant. Typeahead cannot be disabled.
- Log level.
- Log types
- About
- Displays information about the GBC version.
- [Debug] AUI Tree
- Opens the AUI debug tree for the current application.
- Proxy logs
- Opens the current application session log in a new tab. Use this to view the status of proxies, responses sent, and system error messages. See Log files in the Genero Application Server User Guide.
- VM logs
- Opens the Dynamic Virtual Machine (DVM) log for DVMs started by the application. The log opens in a new tab.
- Run in GDC
- Downloads a shortcut allowing you to open the current application with the Genero Desktop Client (GDC).
- Upload status
- Indicates that a file is being uploaded into your application. This displays first as an icon and then as a percentage. When all files are uploaded, the upload status disappears from the chromebar. If the upload is fast, you may never see the upload status. To change the icon, see Change file loading icon. To center the icon and percentage on the screen, see Center file loading icon.
- Runtime status
- Displays a progress bar that indicates the GBC is waiting for a response
from the server. Tip:
You can see this progress bar in the GWC demo directory. Navigate to and doubleclick the ProgressBar application.
- Bookmark
- Adds a bookmark for the application to the Bookmarks panel on the GBC home page.
- Close window
- Closes the selected application. Upon closing, you are taken to the next
open application in the sidebar. If there are no more applications in the sidebar, the GBC displays
the application ended page.Note:
The Close window icon may not be shown while an application is expecting user input or other action.