Viewing information about the GAS
Statistics computed by the Genero Application Server (GAS) dispatcher are fed into the monitor URL page. Use this page to monitor and troubleshoot GAS operations.
When you open the monitor page, the dispatcher gathers information from all the proxies it has
launched such as: number of DVM started by a proxy, the process IDs (PIDs) of each DVM, date and
time of the last request, etc. This information is then put together and displayed in the browser.
Note: The information displayed represents the state of the dispatcher and proxies at the time of
the request. This may change over time if you do the same request one second later for
instance.
Tip: Data is displayed in XML format. You can modify the way statistics are presented by
customizing the monitor.xslt file located in
$FGLASDIR/web/fjs.
Use this list to check the current status and operations of the GAS:
- If, for example, you are troubleshooting HTTP request failures, use the Dispatcher logs file link found at the top of the page to open a page where logs are displayed.
-
If you need statistics about the CPU usage of the dispatcher, go to the Dispatcher resources usage section of the page. See Dispatcher resources usage.
- If you need to manage Genero Archives and Genero Browser Clients deployed on the GAS, use the Deployment portal link to access a tool for this purpose.
- Your GAS may have invalid configuration files for Web services. You can check for this by using a link to the Invalid configuration files tool in the General information section.
- If you are monitoring or troubleshooting Web services, go to the Monitoring for GWS proxies section of the page. See Monitoring for GWS proxies.
- If you are monitoring or troubleshooting Web applications, go to the Monitoring for UA proxies section of the page. See Monitoring for UA proxies.
- If you are monitoring statistics by HTTP type requests, go to the Monitoring for HTTP requests section of the page. See Monitoring for HTTP requests.
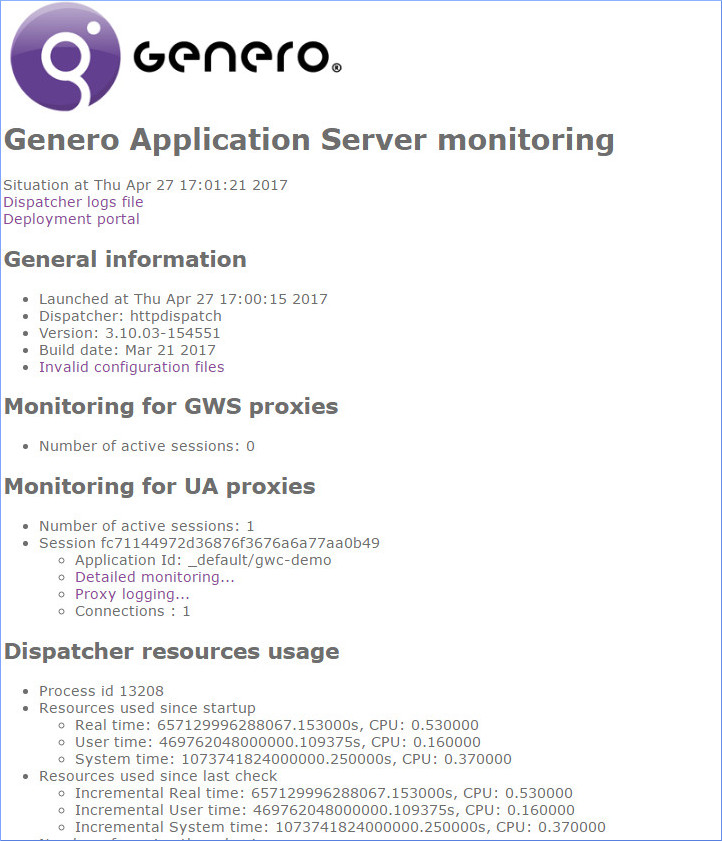
- General information
- Use this section to check details about the dispatcher in use:
- Dispatcher name (for example, httpdispatch, isapidispatch, etc.)
- Date and time launched
- Version
- Build date
A link to Invalid configuration files provides you with access to a tool to check for invalid configuration files for Web services in the GAS.
- Monitoring for GWS proxies
-
If you are monitoring Web services running on the GAS, the number of active Web services (GWS) sessions is shown. If sessions are active they are listed by session id, and within that by application ids and number of connections. If you need to troubleshoot or view log details, you can access the logs by clicking on links:
- Detailed monitoring… opens a Genero Session Monitoring page where you can monitor information about the session, such as the proxy, the environment, the DVM, etc.
- Proxy logging... opens a page showing the gwsproxy log, which contains a chronology of activity since the proxy started.
- Monitoring for UA proxies
-
Use this section to get information about the number of active Web application sessions.
If sessions are active, a list of the session ids are shown. You can see what applications (application id) are running and how many connections are used in a session. If you need further details, you can access the relevant logs by clicking on these links:- Detailed monitoring… opens a Genero Session Monitoring page where you can monitor information about the session: the proxy, the environment, the DVM, etc.
- Proxy logging... opens a page showing the uaproxy logs containing a chronology of activity since the proxy started.
- Dispatcher resources usage
- Monitoring the dispatcher resource usage provides you with the following details:
- Monitoring for HTTP requests
-
If you need to know, for example, how many requests for Web services are being handled by the GAS, monitoring HTTP requests for /ws/r in this section, provides you with the following information:
- Handled requests
- In-progress requests
- Successful requests
- Average time
- Last request time
Use this section to monitor the HTTP requests for Web applications, Web services, and monitoring.