The statistics or information provided by the GAS Monitor can be viewed in two steps.
Step 1: Viewing information about the dispatcher
When you first access the GAS Monitoring page, information is provided about the Dispatcher.
Example: http://localhost:6394/monitor provides the dispatcher details.
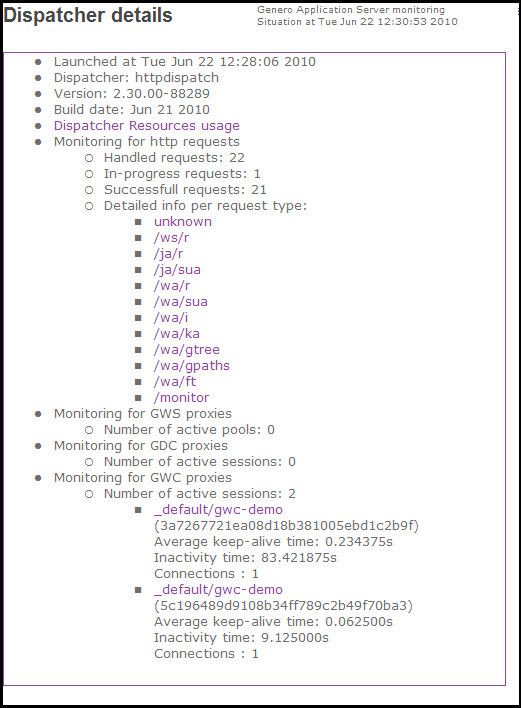
Figure 1. Monitoring: Dispatcher details
Example: http://localhost/gas/monitor provides the dispatcher details.
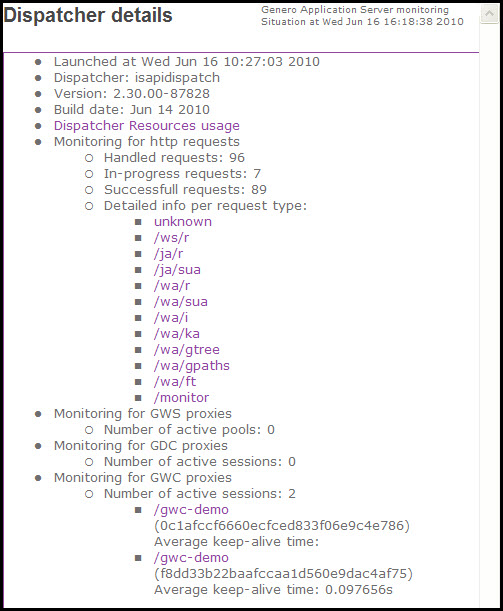
Figure 2. Monitoring: Dispatcher details
From this page, you can view Dispatcher Resources usage information by clicking on the Dispatcher Resources usage link.
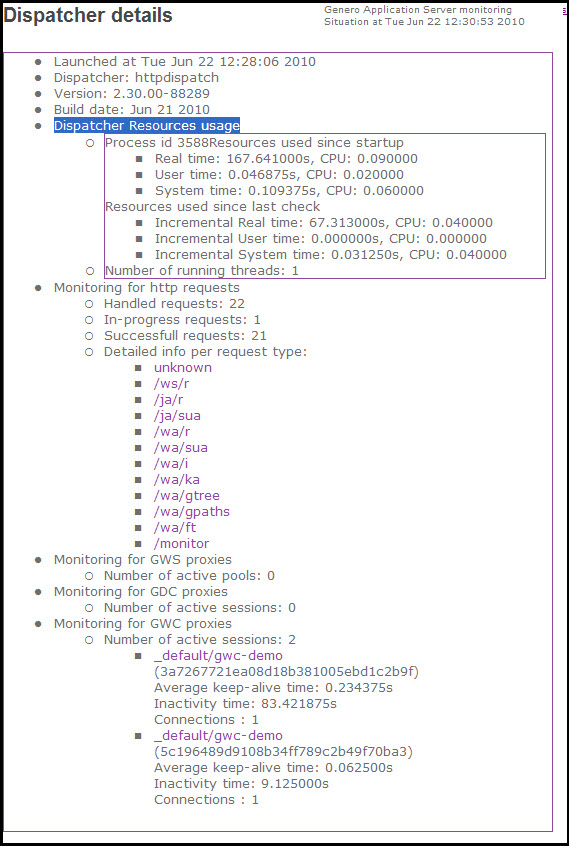
Figure 3. Monitoring: Dispatcher Resources usage
You can monitor detailed information per request type by clicking one of the request type links. For more information on what each of the request types are, see URIs Acknowledged by the GAS.
For example, to see statistics relating to the launching of a GWC application, you could select to view the statistics for the request type /wa/r.
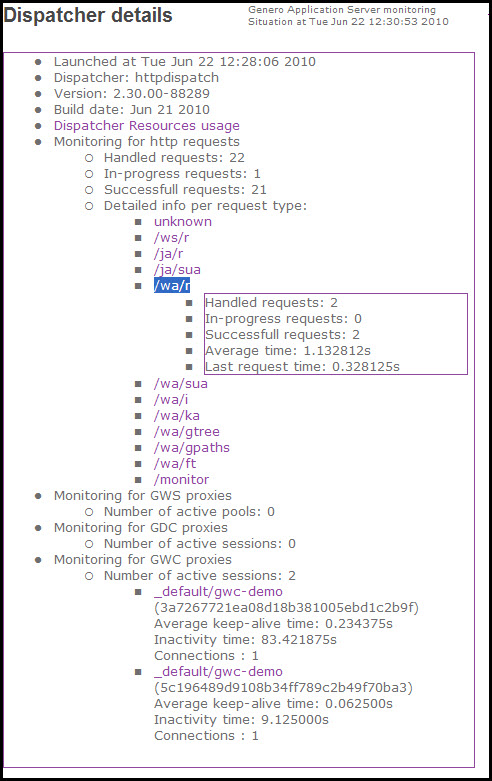
Figure 4. Monitor: Statistics for /wa/r
Step 2: Viewing information about the VMProxies
In addition to viewing statistics about the dispatcher, you can also view statistics about a session by clicking on session links under the Monitoring for GWS / GDC / GWC proxies sections. The statistics and information for the session - for the proxy - appear in a separate window. To return to the Dispatcher window, you must close the Session window.
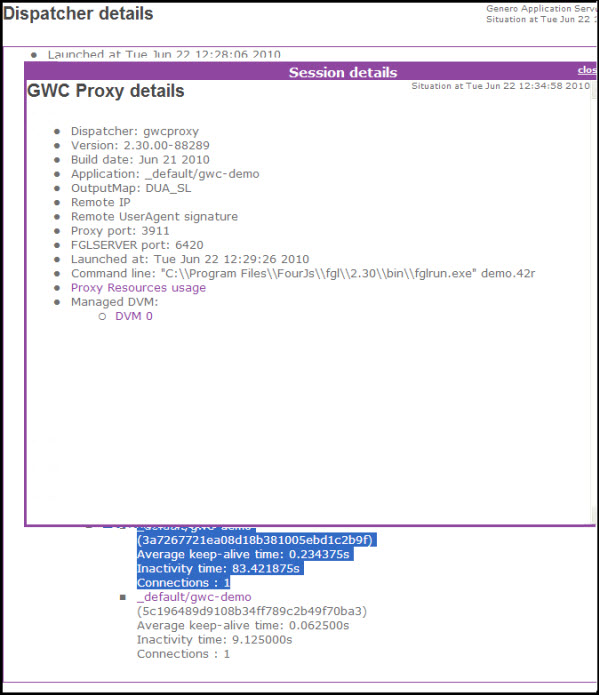
Figure 5. Viewing proxy statistics