Monitor proxies and DVM
Follow this procedure if you need to troubleshoot or get a more detailed view of the current status and operations of the proxy and the DVM for a selected session.
In addition to viewing summary statistics about the dispatcher and proxies in the monitor page, you may also need to view more detailed statistics about a session.
This level of detail is provided by the Detailed monitoring… tool.
-
Select the Detailed monitoring… link for the proxy and session you
wish to monitor. You will find links in the Monitoring
for UA proxies and Monitoring for GWS proxies sections.
The page (http://localhost:6394/monitor/session_id) opens in a browser tab. Details are shown for the proxy, the environment, and the applications running in the session.
-
If you are viewing details for a web application session, you will see details similar to that shown in Figure 1. Use the information in Table 1 as a reference to help you with analysis of the session data.
Figure: Viewing UA proxy session statistics 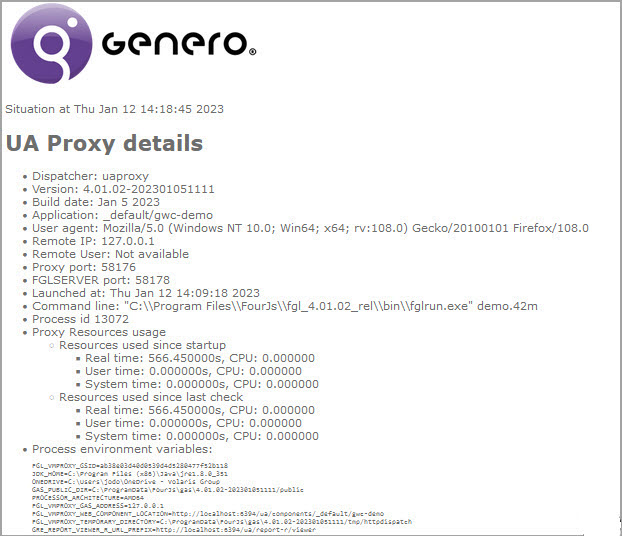
Table 1. UA Proxy Details Proxy details Description Dispatcher Names the uaproxy. Version Gives the proxy version number. Build date Shows the proxy build date. Application Shows the name of the application running in the format " group-name/app-name".User agent Gives details of user agent, for example, browser type and version. Remote IP Shows the IP address of the server. Remote User Gives the name of the user on the server. Proxy port Shows the port number proxy is listening on. FGLSERVER port Shows the port number FGLSERVER is listening on. Launched at Shows the date and time the proxy was launched. Command line Gives the path to the DVM. Process id Shows the proxy process ID. Proxy Resources usage Details of resources used by the proxy process are given: - Resources used since
start-up
- Real time gives the total time in seconds the process took.
- User time and CPU time gives the time it takes to execute the process.
- System time and CPU time gives the time spent in system calls to the kernel executing the process.
- Resources used since last check
- Real time gives the total time in seconds the process took.
- User time and CPU time gives the time it takes to execute the process.
- System time and CPU time gives the time spent in system calls to the kernel executing the process.
Process environment variables Provides a list of the environment variables set on the system. DVM (list of sessions identified by IDs) Details of applications (identified by ID) running in the session are given. These are grouped by: - Start url shows the URL used to start application.
- Command line shows the path to the DVM.
- Connection string: meta Connection shows metadata that includes language encoding, runtime version, frontEndID, procId, and so on.
- Launch date shows the date and time the DVM was launched.
- Last /ua/sua date shows the date and time of last submitted user action request.
- Last /ua/sua url shows the URL of last submitted user action request.
- Resources used since
start-up
- If you are viewing details for a web services session, you will see details similar to
that shown in Figure 2. Use the information
in Table 2 as a reference to help
you with analysis of the session data.
Figure: Viewing GWS proxy session statistics 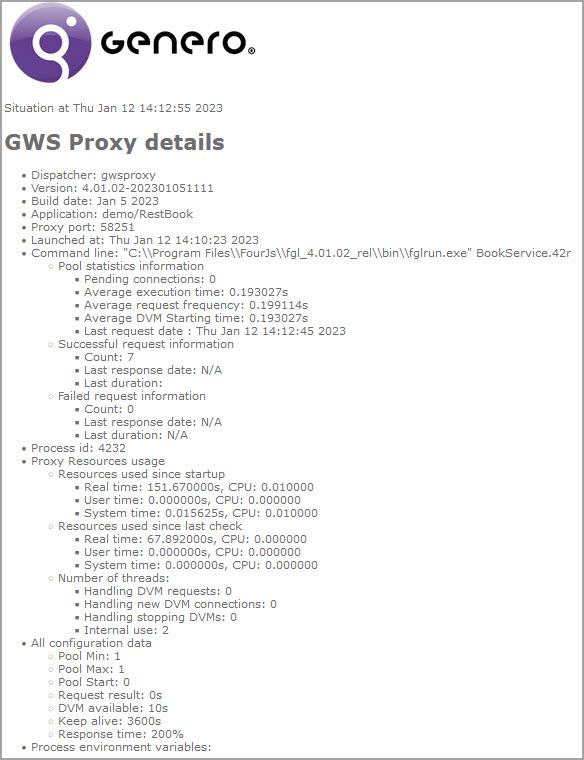
Table 2. GWS Proxy Details Proxy details Description Dispatcher Names the gwsproxy. Version Gives the proxy version number. Build date Shows the proxy build date. Application Shows the name of the application running in the format " group-name/app-name".Proxy port Shows the port number proxy is listening on. Launched at Shows the date and time the proxy was launched. Command line Gives the path to the DVM, and the command used to start the DVM of the web service. Statistics about requests running in the session are given. These are grouped by: - Pool statistics information:
- Pending connections shows the number of requests waiting to be processed. Requests for web services are processed by the GWS proxy and are managed using the DVM pool. For more details, see the Web service page.
- Average execution time shows how long it takes to execute a request.
- Average request frequency shows how often requests are received.
- Average DVM starting time shows how long it takes to start the DVM.
- Last request date gives the date and time of the last request to the service.
- Successful request information:
- Count gives the number of successfully processed requests.
- Last response date shows the date and time of last response from the service.
- Last duration gives the duration of the last request to the service.
- Failed request information:
- Count gives the number of failed requests.
- Last response date shows the date and time of last failed request.
- Last duration gives the duration of the last failed request to the service.
Process id Shows the proxy process ID. Proxy Resources usage Details of resources used by the proxy process are given: - Resources used since start-up
- Real time gives the total time in seconds the process took.
- User time and CPU time gives the time it takes to execute the process.
- System time and CPU time gives the time spent in system calls to the kernel executing the process.
- Resources used since last check
- Real time gives the total time in seconds the process took.
- User time and CPU time gives the time it takes to execute the process.
- System time and CPU time gives the time spent in system calls to the kernel executing the process.
- Number of threads gives the number of threads the gwsproxy creates and uses in requests to:
- Handle the connection in progress (Handle DVM requests)
- Handle new incoming connections (Handling new DVM connections)
- Handle the DVM that are in a stopping progress (Handling stopping DVM)
- Handle internal communication (Internal use).
All configuration data Details of the application configuration are given: - Pool Min the minimum number of DVMs that can attach in the POOL for the service as specified in MIN_AVAILABLE.
- Pool Max the maximum number of DVMs allowed to attach for the service as specified in MAX_AVAILABLE.
- Pool Start the number of DVMs to start for the web service as specified in START.
- Request result the number of seconds the GAS waits for the DVM to respond to pending transactions as specified in REQUEST_RESULT (for a service).
- DVM available the number of seconds allowed for the DVM to start as specified in DVM_AVAILABLE. The GAS default is 10 seconds.
- Keep alive the number of seconds the proxy waits before shutting down when no longer serving requests as specified in KEEP_ALIVE. The GAS default is 3600 seconds.
- Response time The response time is set to 200%. It defines the reactivity of the gwsproxy to start or stop new DVMs.
Process environment variables Provides a list of the environment variables set on the system. DVM (list of sessions identified by IDs) Details of applications (identified by ID) running in the session are given. These are grouped by: - Launch date shows the date and time the DVM was launched.
- Process id shows the DVM process ID.
- Logs provides a link to the log page for the DVM.
- Busy shows "yes" or "no", depending on whether the DVM is currently busy or not.
- Request start date shows the start date and time of the current request, or may show "no request in progress".
- Last request date shows date and time of last request.
- Request count gives the number of requests received.
- Number of running threads gives the number of threads used by the DVM.
- Pool statistics information:
-